Long
TomoChain (TOMO) Long-Term Uptrend Mapped
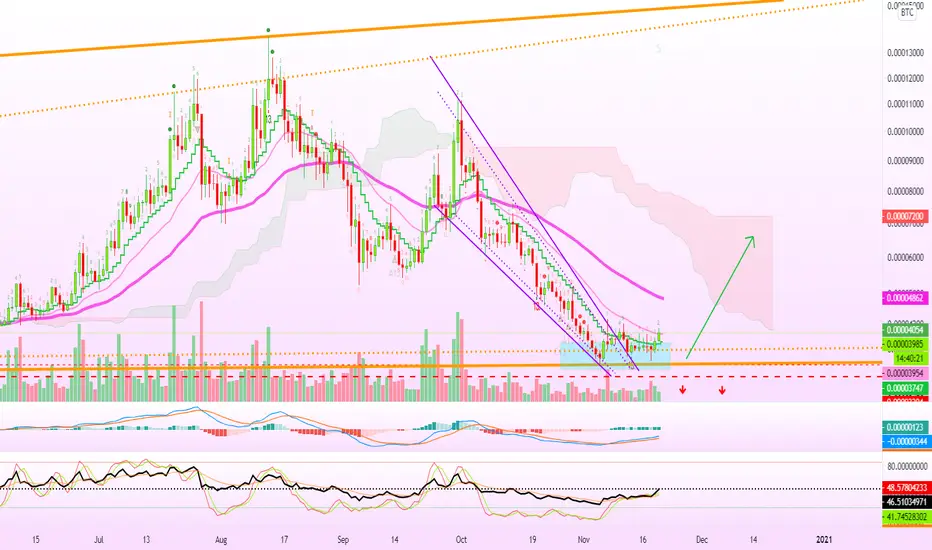
Here I will show you TOMOBTC (TomoChain) in a long-term uptrend... We have higher highs and higher lows since late 2019. 
Now, the long-term chart is, well... long-term.
Notice the main one above where we look at the daily timeframe.
Here I draw a strong descending channel or falling wedge that already broke in favor of the bulls.
The stronger/steeper/faster the drop, the bigger the bounce when to the other side.
Here we have prices above EMA10 and EMA21.
TOMOBTC will hit next at least EMA50 at 0.00004862, but it is also very likely to continue even higher.
This is it... Enjoy the profits as they come.
Namaste.
Now, the long-term chart is, well... long-term.
Notice the main one above where we look at the daily timeframe.
Here I draw a strong descending channel or falling wedge that already broke in favor of the bulls.
The stronger/steeper/faster the drop, the bigger the bounce when to the other side.
Here we have prices above EMA10 and EMA21.
TOMOBTC will hit next at least EMA50 at 0.00004862, but it is also very likely to continue even higher.
This is it... Enjoy the profits as they come.
Namaste.

Trading Cryptocurrencies can be the hardest undertaking ever without the right trade-numbers, without accurate private-access information. Free is free, but the best always requires sweat, an investment. Since 2017 👇
t.me/masteranandatrades/8778
t.me/masteranandatrades/8778
Bài đăng liên quan
Thông báo miễn trừ trách nhiệm
Thông tin và các ấn phẩm này không nhằm mục đích, và không cấu thành, lời khuyên hoặc khuyến nghị về tài chính, đầu tư, giao dịch hay các loại khác do TradingView cung cấp hoặc xác nhận. Đọc thêm tại Điều khoản Sử dụng.
Trading Cryptocurrencies can be the hardest undertaking ever without the right trade-numbers, without accurate private-access information. Free is free, but the best always requires sweat, an investment. Since 2017 👇
t.me/masteranandatrades/8778
t.me/masteranandatrades/8778
Bài đăng liên quan
Thông báo miễn trừ trách nhiệm
Thông tin và các ấn phẩm này không nhằm mục đích, và không cấu thành, lời khuyên hoặc khuyến nghị về tài chính, đầu tư, giao dịch hay các loại khác do TradingView cung cấp hoặc xác nhận. Đọc thêm tại Điều khoản Sử dụng.