
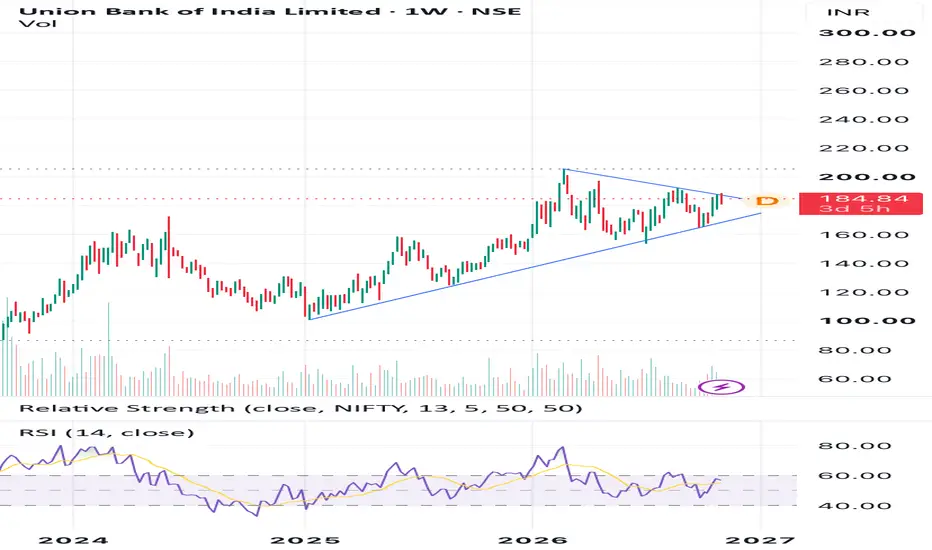
1. Pattern – Symmetrical Triangle
The stock is consolidating within a triangle after a strong upward rally. It is forming lower highs and higher lows, indicating a narrowing price range.
2. Upper Trendline – Resistance
* Immediate resistance: ₹188–192
* Major resistance: ₹200–205
* A strong weekly close above ₹192 with volume can signal a bullish breakout.
3. Lower Trendline – Support
* Important support zone: ₹168–173
* This is the rising support line connecting previous higher lows.
* A bullish reversal near this zone could provide a favourable entry opportunity.
4. RSI Analysis
* Weekly RSI is approximately 55.
* Momentum is neutral to mildly bullish.
* RSI moving above 60 would strengthen the bullish outlook.
5. Buying Strategy
* Conservative entry: Wait for a breakout above ₹192 with strong volume.
* Aggressive entry: Consider buying near ₹168–173 after bullish reversal confirmation.
* Avoid fresh buying if the stock breaks below the rising trendline decisively.
Disclaimer: This analysis is based purely on technical chart patterns and indicators for educational and informational purposes. It is not investment advice or a recommendation to buy or sell. Stock market investments are subject to market risks. Please conduct your own research or consult a SEBI-registered financial advisor before making any investment decision.
The stock is consolidating within a triangle after a strong upward rally. It is forming lower highs and higher lows, indicating a narrowing price range.
2. Upper Trendline – Resistance
* Immediate resistance: ₹188–192
* Major resistance: ₹200–205
* A strong weekly close above ₹192 with volume can signal a bullish breakout.
3. Lower Trendline – Support
* Important support zone: ₹168–173
* This is the rising support line connecting previous higher lows.
* A bullish reversal near this zone could provide a favourable entry opportunity.
4. RSI Analysis
* Weekly RSI is approximately 55.
* Momentum is neutral to mildly bullish.
* RSI moving above 60 would strengthen the bullish outlook.
5. Buying Strategy
* Conservative entry: Wait for a breakout above ₹192 with strong volume.
* Aggressive entry: Consider buying near ₹168–173 after bullish reversal confirmation.
* Avoid fresh buying if the stock breaks below the rising trendline decisively.
Disclaimer: This analysis is based purely on technical chart patterns and indicators for educational and informational purposes. It is not investment advice or a recommendation to buy or sell. Stock market investments are subject to market risks. Please conduct your own research or consult a SEBI-registered financial advisor before making any investment decision.

Thông báo miễn trừ trách nhiệm
Thông tin và các ấn phẩm này không nhằm mục đích, và không cấu thành, lời khuyên hoặc khuyến nghị về tài chính, đầu tư, giao dịch hay các loại khác do TradingView cung cấp hoặc xác nhận. Đọc thêm tại Điều khoản Sử dụng.
Thông báo miễn trừ trách nhiệm
Thông tin và các ấn phẩm này không nhằm mục đích, và không cấu thành, lời khuyên hoặc khuyến nghị về tài chính, đầu tư, giao dịch hay các loại khác do TradingView cung cấp hoặc xác nhận. Đọc thêm tại Điều khoản Sử dụng.