
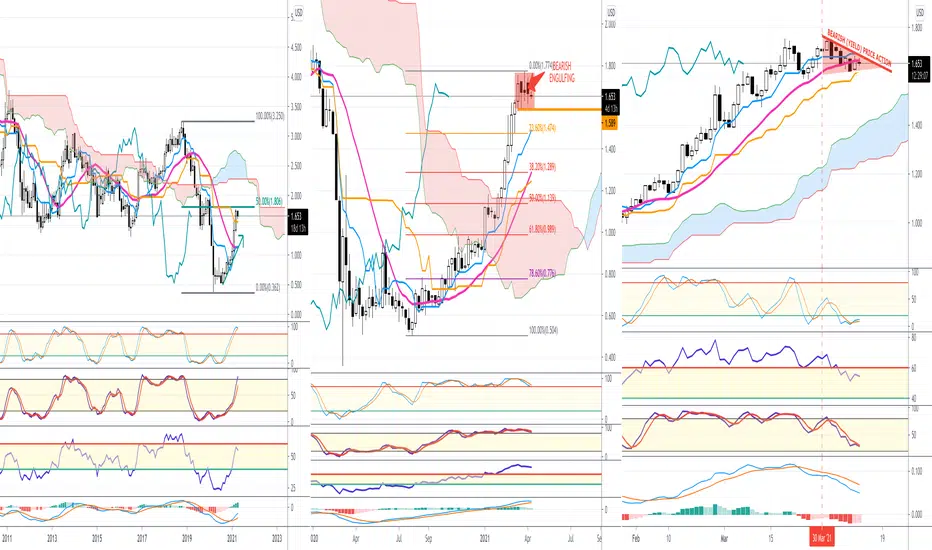
M1 : Long term picture is showing a failure to breakout the 50 % Fibonacci retracement
@ 1.8060 % , high seen being 1.7740 %
Price action seen during February and March is showing, first of all, a breakout of the Mid Bollinger
Band, which was at that time @ 1.1460% in February which has been confirmed by a second breakout of the Kijun-Sen line
which was at that time in March @ 1.5660 (same level now).
Therefore, on a monthly view and on a closing basis a move below 1.5660 would trigger further downside move.
W1 : Price action seen over the last couple of weeks is showing some lack of momentum; indeed after a succession of white
candles we can see a clear break of the upside movement which triggered a sideways price action with a bearish engulfing pattern
which took place last week
Trigger level on this time frame is @ 1.5890 (see D1 comment below)
D1 : Currently in a bearish (yield) mode price action. Mid Bollinger band is under attack with already one closing price below it.
A failure to hold above 1.5890 would confirm a double top pattern in opening the door for a technical target of 1.4040% which is currently
the middle zone of the daily clouds support !
@ 1.8060 % , high seen being 1.7740 %
Price action seen during February and March is showing, first of all, a breakout of the Mid Bollinger
Band, which was at that time @ 1.1460% in February which has been confirmed by a second breakout of the Kijun-Sen line
which was at that time in March @ 1.5660 (same level now).
Therefore, on a monthly view and on a closing basis a move below 1.5660 would trigger further downside move.
W1 : Price action seen over the last couple of weeks is showing some lack of momentum; indeed after a succession of white
candles we can see a clear break of the upside movement which triggered a sideways price action with a bearish engulfing pattern
which took place last week
Trigger level on this time frame is @ 1.5890 (see D1 comment below)
D1 : Currently in a bearish (yield) mode price action. Mid Bollinger band is under attack with already one closing price below it.
A failure to hold above 1.5890 would confirm a double top pattern in opening the door for a technical target of 1.4040% which is currently
the middle zone of the daily clouds support !

Bài đăng liên quan
Thông báo miễn trừ trách nhiệm
Thông tin và các ấn phẩm này không nhằm mục đích, và không cấu thành, lời khuyên hoặc khuyến nghị về tài chính, đầu tư, giao dịch hay các loại khác do TradingView cung cấp hoặc xác nhận. Đọc thêm tại Điều khoản Sử dụng.
Bài đăng liên quan
Thông báo miễn trừ trách nhiệm
Thông tin và các ấn phẩm này không nhằm mục đích, và không cấu thành, lời khuyên hoặc khuyến nghị về tài chính, đầu tư, giao dịch hay các loại khác do TradingView cung cấp hoặc xác nhận. Đọc thêm tại Điều khoản Sử dụng.