
Phase: 1
Date & Time: 2026-03-30 01:35 EST
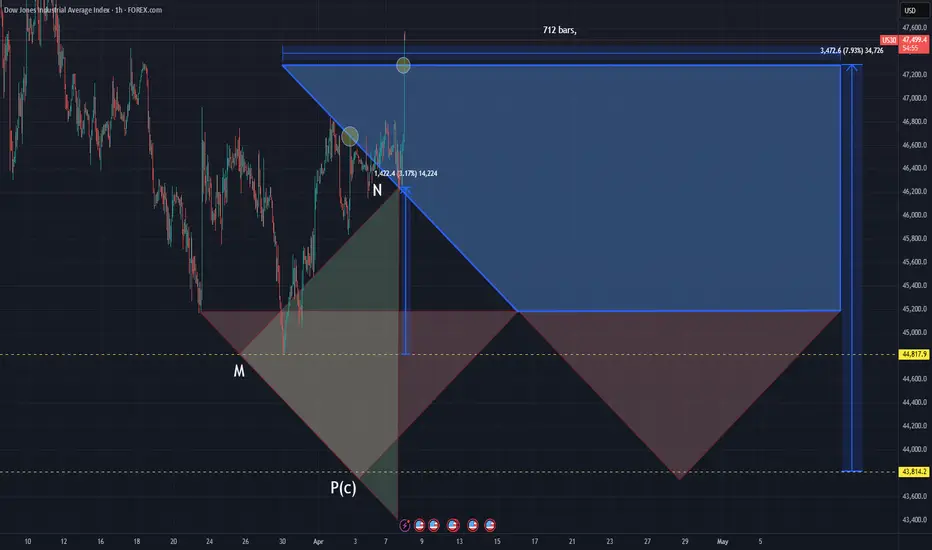
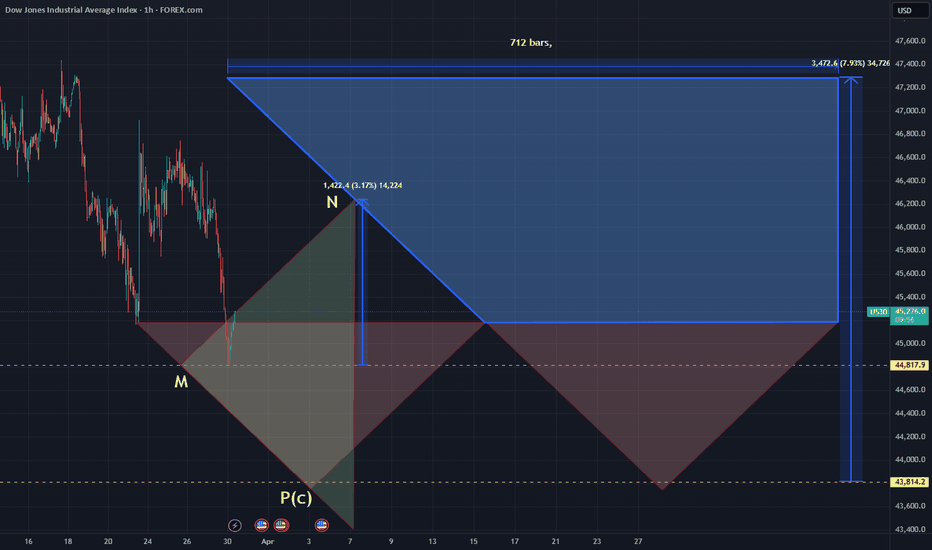
Primary Entry M: 44,817.9 $
Secondary Entry P(c): 43,814.2$
Mean Entry: (44,817.9 +43,814.2)/2=44,316$
Trapezoid Time Duration: 42 Days
3th Triangle domain (%): 2 * 3.17% = 6.34%
Risk coefficient (R): 1
Risk domain (%) (D): (3th Triangle domain) *(Risk coefficient) = 6.34%*1 = 6.34 %
Hypothetical Capital: 100,000$
Contract Size: 10 Unit
Expected Max Drawdown (%): 5%
Expected Max Drawdown $ (EMDD): 100,000 * 5% = 5,000
Expected Low Price: (1 – 6.34%) * 44,316 $ = 41,506.36$
Size: 5,000 / (44,316 – 41,506.36) ~= 1.7795 Unit
Position Size: Size/Contract Size = 1.7795/10 = 0.178 ~ 0.18
Each Trade Size = 0.18 /2 = 0.09
Targets:
T1 (Mirror / Lower Trapezoid): 45,182$
T2 (Apex N): 46,246 $
T3 (Trapezoid Top): 47,284$
Expected Profit by first entry and Exit at T3 for Scenario No 1:
(T3 - Entry M) * Contract Size * Each Trade Size = (47,284 -44,817.9) *10*0.09= 2,219$
Expected Total Profit for Scenario No 1: 2,219$
Expected Return % for Scenario No 1: 100*(2,219/100,000) = 2.22%
Expected Annual Return% for Scenario No 1: (2.22%*365/42) =19.29%
Expected Profit by 2th entry and Exit at T2 for Scenario No 2:
(T3 - Entry M) * Contract Size * Each Trade Size = (47,284 -44,817.9) *10*0.09= 2,219$
(T2 - Entry P(c)) * Contract Size * Each Trade Size = (46,246 -43,814.2) *10*0.09= 2,189$
Expected Total Profit for Scenario No 2: 2,219+2,189=4,408$
Expected Return% for Scenario No 2: 100*(4,408/100,000) =4.41%
Expected Annual Return% for Scenario No 2: 4.41%*365/42=38.32%
Notes: P(c) may or may not be reached; both M and P(c) are Phase 1 only.
"Both trade sizes are calculated using the hypothetical capital, the investor’s maximum allowed drawdown, the 3rd Triangle Domain percentage, the Risk Coefficient, and the Contract Size."
TotalSize=(EMDD=5000)/(2*D*R*MeanPrice*ContractSize)
Will the next phase be Phase 2 or 3? We are navigating the market to see what happens next.
Phase:3
Date & Time: 2026-03-31 12:40 EST
Before the price touches the Left Trapezoid Boundary on delayed mirror, climbed to the N price level as T2, reaching 46,246$.
Up to this point, the initial position was opened at 44,817.9$ on M level and the Phase3 is completed by reaching the Price at 46,246$. So the price has not retraced down to the P(c) level. Will the next phase be Phase 2? We are navigating the market to see what happens next.
Phase: 2
Date & Time: 2026-04-02 10:40 EST
The Price touched the Delayed Mirror at 46,672$, and The Delayed Mirror touched after phase3.
Before touching the delayed mirror, the price climbed to reached the N Level Price at 46,246$.
Up to this point, the initial position was opened at 44,817.9$ on M level and the Phase2 is completed by touching the Delayed Mirror at 46,672$. Will the next phase be Phase 4? We are navigating the market to see what happens next.
Phase: 4
Current Date & Time: 2026-04-07 18:40 EST
First, the price triggered for opening of the first position in M level at 44,817.9 USD, then goes directly to the N Price Level at 46,246 and phase 3 was completed before phase 2. After phase 3 the price touched the Delayed Mirror at 46,672$ and phase 2 is completed too. Then, the price came down to N level. Finally the price grows up to the trapezoid upper boundary at 47,284 USD, for completing Phase 4.
The Price Moves to target 3 as like as expected Scenario 1 in Phase 1.
The expected total profit for Scenario No. 1 in Phase 1 was $2,219 and has now been realized completely by 2,219$ by closing the Position 1 on phase 4.
Realized Return (%): 100*(2,219/100,000) = 2.22%
The lowest Price in this path was 44,810$ and the Maximum drawdown calculate as:
(44,817.9$-44,810$) *10*0.09 = -7.11$
Max Drawdown (%): 100*(-7.11/100,000) =-0.007%
Trapezoid Time Duration: 42 Days
Realized Time Duration: 9 Days
After reaching the N price level and interacting with the delayed mirror—thereby completing Phases 3 and 2—the price increased up to the upper boundary of the trapezoid and cycle is completed.

Bài đăng liên quan
Thông báo miễn trừ trách nhiệm
Thông tin và các ấn phẩm này không nhằm mục đích, và không cấu thành, lời khuyên hoặc khuyến nghị về tài chính, đầu tư, giao dịch hay các loại khác do TradingView cung cấp hoặc xác nhận. Đọc thêm tại Điều khoản Sử dụng.
Bài đăng liên quan
Thông báo miễn trừ trách nhiệm
Thông tin và các ấn phẩm này không nhằm mục đích, và không cấu thành, lời khuyên hoặc khuyến nghị về tài chính, đầu tư, giao dịch hay các loại khác do TradingView cung cấp hoặc xác nhận. Đọc thêm tại Điều khoản Sử dụng.