
The US 500 index has been on quite a run recently, initially supported by a surge in risk sentiment from the start of April after a ceasefire was agreed between the US-Iran, but perhaps just as importantly by the shift of focus for traders back to a more optimistic stance regarding the impact of artificial intelligence on future corporate revenue after a period of uncertainty.
This up move has primarily been led by a surge in mega technology companies such as Apple, which briefly revisited all-time highs, and Alphabet that spiked to a new record, both after the release of stronger results last week. To put some numbers to it, the US 500 jumped 11% from its lows at 6518 on April 1st up to a record peak of 7277 on May 1st.
Moving forward, things could be trickier to navigate as traders face up to the old adage for stock markets - “sell in May and go away”. For example, tensions in the Middle East briefly ramped up on Monday with the US-Iran exchanging fire, as President Trump attempted to follow through on a weekend commitment to open the flow of Oil shipping from neutral countries through the Strait of Hormuz. This helped the US 500 to briefly drop back to 7178, however prices have since recovered to post new record highs at 7299 this morning after the White House signalled progress being made toward a final agreement between Washington and Tehran (Bloomberg).
The important issue traders are wrestling with seems to be, the longer energy prices stay elevated the greater chance of it feeding higher inflation in the US, an issue that could force the Federal Reserve to hike interest rates, which as a rule can weigh on risk sentiment, economic growth and corporate earnings.
A key component of the Fed decision making process could be the current health of the labour market. While, traders may pay attention to today’s release at 1315 BST of the US ADP private sector payrolls, or the weekly jobless claims update due for release on Thursday at 1330 BST, their key focus may be the latest Non-farm payrolls on Friday at 1330 BST. If this update shows US employment remains resilient it could convince policymakers that there is room to raise interest rates in June to regain control of inflation. A factor that could weigh on the recent US 500 rally, even lead to some profit taking.
Technical Update: Watching Closing Defence of 7283 Fibonacci Extension Level
When an index pushes into uncharted territory of new all‑time highs, identifying meaningful resistance becomes inherently difficult because there are no historical reference points of previous highs to gauge price activity. In these situations, Fibonacci extension levels can provide a useful framework by projecting potential upside barriers based on prior price swings.
These extensions don’t guarantee where price strength will stall, but they can highlight levels where an advance may slow or even reverse, giving traders a focal point that might otherwise be absent. Being aware of these projected levels can help gauge where upside moves might begin to encounter resistance and where risk‑reward dynamics may shift, or if successful closing upside breaks are seen, when further upside momentum may emerge.

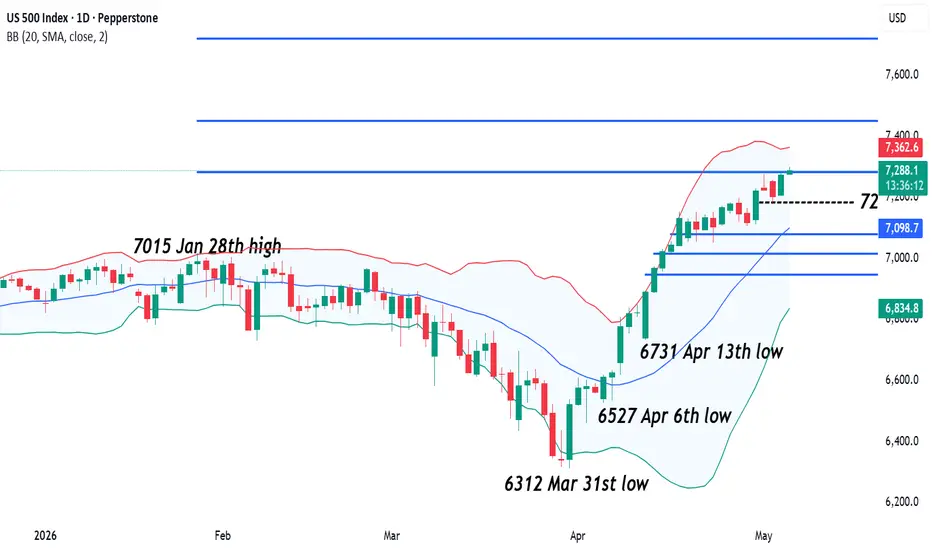
As the chart above shows, the US 500 index continues to find support, and the advance from the 31st March low (6312) has extended into new all‑time highs. However, the latest strength looks to currently be challenging resistance at 7283 (0645 BST), a level that aligns with the 38.2% Fibonacci extension of the January 28th to March 31st decline. How this level is defended on a closing basis could be important in determining the next directional move.
Potential Resistance Levels:
Having recently seen 7283 attempt to cap the latest advance, this level could be a key resistance focus for traders. While not a guarantee of continued strength, closing breaks above 7283 might encourage further attempts to extend the current positive momentum.
If closing breaks above 7283 are seen this week, the focus for traders may then shift toward higher Fibonacci extension levels as the next potential resistance points. This could see attempts to extend the uptrend toward 7450, which is the 61.8% extension, and if this level gives way, even toward 7720, which aligns with the 100% extension.
Potential Support Levels:
It has already been a sustained period of price strength, and it might be argued that over‑extended upside conditions may now be in place. If so, prices could be vulnerable to corrections as a reaction to the latest advance, particularly if the 7283 level continues to hold as resistance on a closing basis. As the chart below shows, the first key support may now stand at 7202, a level equal to half latest price strength. This may be the initial downside focus should weakness begin to develop.
If price weakness materialises after the latest advance, it may be closing breaks below 7202 that prove to be important. Such a move could then open scope for further downside toward 7081, which is the 38.2% retracement of the April 13th to May 6th advance. If 7081 were also to give way, weakness could extend toward 7014, the 50% retracement, and possibly even 6947, which is the 61.8% level.
The material provided here has not been prepared accordance with legal requirements designed to promote the independence of investment research and as such is considered to be a marketing communication. Whilst it is not subject to any prohibition on dealing ahead of the dissemination of investment research, we will not seek to take any advantage before providing it to our clients.
Pepperstone doesn’t represent that the material provided here is accurate, current or complete, and therefore shouldn’t be relied upon as such. The information, whether from a third party or not, isn’t to be considered as a recommendation; or an offer to buy or sell; or the solicitation of an offer to buy or sell any security, financial product or instrument; or to participate in any particular trading strategy. It does not take into account readers’ financial situation or investment objectives. We advise any readers of this content to seek their own advice. Without the approval of Pepperstone, reproduction or redistribution of this information isn’t permitted.
This up move has primarily been led by a surge in mega technology companies such as Apple, which briefly revisited all-time highs, and Alphabet that spiked to a new record, both after the release of stronger results last week. To put some numbers to it, the US 500 jumped 11% from its lows at 6518 on April 1st up to a record peak of 7277 on May 1st.
Moving forward, things could be trickier to navigate as traders face up to the old adage for stock markets - “sell in May and go away”. For example, tensions in the Middle East briefly ramped up on Monday with the US-Iran exchanging fire, as President Trump attempted to follow through on a weekend commitment to open the flow of Oil shipping from neutral countries through the Strait of Hormuz. This helped the US 500 to briefly drop back to 7178, however prices have since recovered to post new record highs at 7299 this morning after the White House signalled progress being made toward a final agreement between Washington and Tehran (Bloomberg).
The important issue traders are wrestling with seems to be, the longer energy prices stay elevated the greater chance of it feeding higher inflation in the US, an issue that could force the Federal Reserve to hike interest rates, which as a rule can weigh on risk sentiment, economic growth and corporate earnings.
A key component of the Fed decision making process could be the current health of the labour market. While, traders may pay attention to today’s release at 1315 BST of the US ADP private sector payrolls, or the weekly jobless claims update due for release on Thursday at 1330 BST, their key focus may be the latest Non-farm payrolls on Friday at 1330 BST. If this update shows US employment remains resilient it could convince policymakers that there is room to raise interest rates in June to regain control of inflation. A factor that could weigh on the recent US 500 rally, even lead to some profit taking.
Technical Update: Watching Closing Defence of 7283 Fibonacci Extension Level
When an index pushes into uncharted territory of new all‑time highs, identifying meaningful resistance becomes inherently difficult because there are no historical reference points of previous highs to gauge price activity. In these situations, Fibonacci extension levels can provide a useful framework by projecting potential upside barriers based on prior price swings.
These extensions don’t guarantee where price strength will stall, but they can highlight levels where an advance may slow or even reverse, giving traders a focal point that might otherwise be absent. Being aware of these projected levels can help gauge where upside moves might begin to encounter resistance and where risk‑reward dynamics may shift, or if successful closing upside breaks are seen, when further upside momentum may emerge.
As the chart above shows, the US 500 index continues to find support, and the advance from the 31st March low (6312) has extended into new all‑time highs. However, the latest strength looks to currently be challenging resistance at 7283 (0645 BST), a level that aligns with the 38.2% Fibonacci extension of the January 28th to March 31st decline. How this level is defended on a closing basis could be important in determining the next directional move.
Potential Resistance Levels:
Having recently seen 7283 attempt to cap the latest advance, this level could be a key resistance focus for traders. While not a guarantee of continued strength, closing breaks above 7283 might encourage further attempts to extend the current positive momentum.
If closing breaks above 7283 are seen this week, the focus for traders may then shift toward higher Fibonacci extension levels as the next potential resistance points. This could see attempts to extend the uptrend toward 7450, which is the 61.8% extension, and if this level gives way, even toward 7720, which aligns with the 100% extension.
Potential Support Levels:
It has already been a sustained period of price strength, and it might be argued that over‑extended upside conditions may now be in place. If so, prices could be vulnerable to corrections as a reaction to the latest advance, particularly if the 7283 level continues to hold as resistance on a closing basis. As the chart below shows, the first key support may now stand at 7202, a level equal to half latest price strength. This may be the initial downside focus should weakness begin to develop.
If price weakness materialises after the latest advance, it may be closing breaks below 7202 that prove to be important. Such a move could then open scope for further downside toward 7081, which is the 38.2% retracement of the April 13th to May 6th advance. If 7081 were also to give way, weakness could extend toward 7014, the 50% retracement, and possibly even 6947, which is the 61.8% level.
The material provided here has not been prepared accordance with legal requirements designed to promote the independence of investment research and as such is considered to be a marketing communication. Whilst it is not subject to any prohibition on dealing ahead of the dissemination of investment research, we will not seek to take any advantage before providing it to our clients.
Pepperstone doesn’t represent that the material provided here is accurate, current or complete, and therefore shouldn’t be relied upon as such. The information, whether from a third party or not, isn’t to be considered as a recommendation; or an offer to buy or sell; or the solicitation of an offer to buy or sell any security, financial product or instrument; or to participate in any particular trading strategy. It does not take into account readers’ financial situation or investment objectives. We advise any readers of this content to seek their own advice. Without the approval of Pepperstone, reproduction or redistribution of this information isn’t permitted.

Global risk Warning CFDs are complex instruments and come with a high risk of losing money rapidly due to leverage. Between 74-89% of retail investor accounts lose money when trading in CFDs. You should consider whether you understand how CFD
Thông báo miễn trừ trách nhiệm
Thông tin và các ấn phẩm này không nhằm mục đích, và không cấu thành, lời khuyên hoặc khuyến nghị về tài chính, đầu tư, giao dịch hay các loại khác do TradingView cung cấp hoặc xác nhận. Đọc thêm tại Điều khoản Sử dụng.
Global risk Warning CFDs are complex instruments and come with a high risk of losing money rapidly due to leverage. Between 74-89% of retail investor accounts lose money when trading in CFDs. You should consider whether you understand how CFD
Thông báo miễn trừ trách nhiệm
Thông tin và các ấn phẩm này không nhằm mục đích, và không cấu thành, lời khuyên hoặc khuyến nghị về tài chính, đầu tư, giao dịch hay các loại khác do TradingView cung cấp hoặc xác nhận. Đọc thêm tại Điều khoản Sử dụng.