

USDCAD Weekly chart gives us an indication of overall price momentum to the downside as price has retested the weekly resistance zone of 1.35200.
Overall a break in upwards channel from
1.34150 has seen USDCAD sustain its shorts over the last 3weeks.
After a break - Price will usually form a pullback/consolidation zone. Perfect for re-entries.
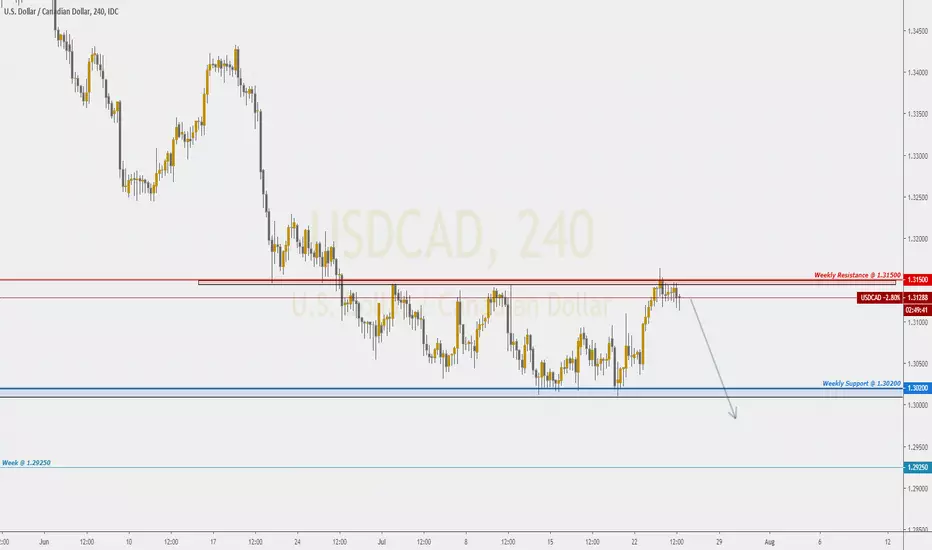
A Weekly Pullback from Support Zone of 1.30200 has encountered yet another wall of weekly resistance of 1.31500.
Weekly Depicted Below

Daily Chart gives us a bearish flag continuation pattern with ideal swing target set at 1.25000
See below D1

Down to the 4HR Chart, a huge range of consolidation confirms our higher time frame bias on going short on USDCAD Overall .

It is important to note that the only driver of higher CAD prices could indeed be fundamental news/ lower OIL prices.
Fundamentally CAD sees itself losing steam gained against the USD as FED may hold true of cutting rates.
Overall a break in upwards channel from
1.34150 has seen USDCAD sustain its shorts over the last 3weeks.
After a break - Price will usually form a pullback/consolidation zone. Perfect for re-entries.
A Weekly Pullback from Support Zone of 1.30200 has encountered yet another wall of weekly resistance of 1.31500.
Weekly Depicted Below
Daily Chart gives us a bearish flag continuation pattern with ideal swing target set at 1.25000
See below D1
Down to the 4HR Chart, a huge range of consolidation confirms our higher time frame bias on going short on USDCAD Overall .
It is important to note that the only driver of higher CAD prices could indeed be fundamental news/ lower OIL prices.
Fundamentally CAD sees itself losing steam gained against the USD as FED may hold true of cutting rates.

Thông báo miễn trừ trách nhiệm
Thông tin và các ấn phẩm này không nhằm mục đích, và không cấu thành, lời khuyên hoặc khuyến nghị về tài chính, đầu tư, giao dịch hay các loại khác do TradingView cung cấp hoặc xác nhận. Đọc thêm tại Điều khoản Sử dụng.
Thông báo miễn trừ trách nhiệm
Thông tin và các ấn phẩm này không nhằm mục đích, và không cấu thành, lời khuyên hoặc khuyến nghị về tài chính, đầu tư, giao dịch hay các loại khác do TradingView cung cấp hoặc xác nhận. Đọc thêm tại Điều khoản Sử dụng.