

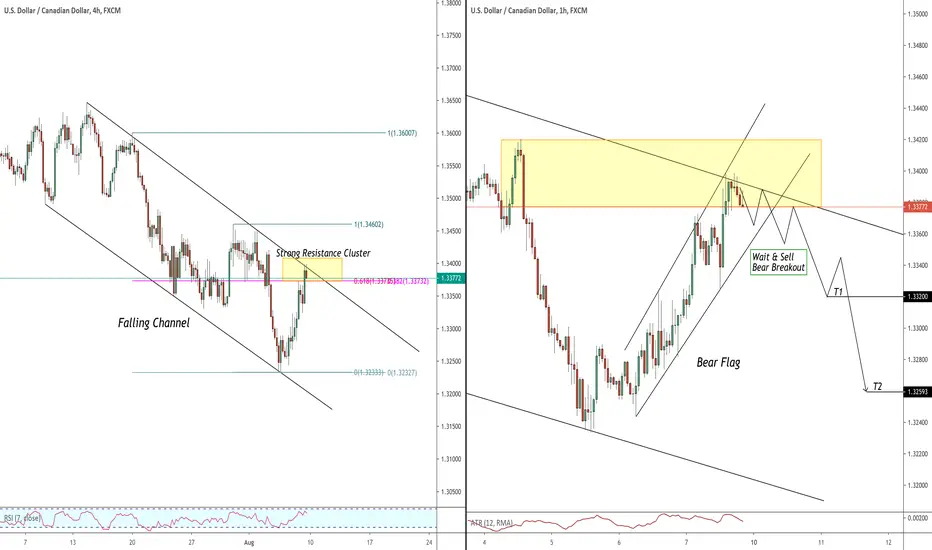
USDCAD is currently trading in a strong bearish trend.
during the last few days, we saw a nice pullback though.
friday's candle closed on a resistance line of a falling channel.
matching with fib.levels of the last legs and a horizontal structure on the left,
the price is now clearly trading within a strong structure resistance area.
to catch a bearish continuation I would suggest being focused on a bearish flag formation on 1H.
we need a 1H candle close below its support to initiate short.
target levels:
1.332
1.326
stop will be above the last flag's high.
in case of a bullish continuation above the underlined resistance cluster,
setup will be invalid.

✅My Telegram Channel: t.me/VasilyTrading
❗️YouTube Channel: youtube.com/c/VasilyTrader
✅ Facebook: facebook.com/VasilyTrading/
⭐ Get 100% Deposit Bonus: bit.ly/bestforexgoldbroker
❗️YouTube Channel: youtube.com/c/VasilyTrader
✅ Facebook: facebook.com/VasilyTrading/
⭐ Get 100% Deposit Bonus: bit.ly/bestforexgoldbroker
Bài đăng liên quan
Thông báo miễn trừ trách nhiệm
Thông tin và các ấn phẩm này không nhằm mục đích, và không cấu thành, lời khuyên hoặc khuyến nghị về tài chính, đầu tư, giao dịch hay các loại khác do TradingView cung cấp hoặc xác nhận. Đọc thêm tại Điều khoản Sử dụng.
✅My Telegram Channel: t.me/VasilyTrading
❗️YouTube Channel: youtube.com/c/VasilyTrader
✅ Facebook: facebook.com/VasilyTrading/
⭐ Get 100% Deposit Bonus: bit.ly/bestforexgoldbroker
❗️YouTube Channel: youtube.com/c/VasilyTrader
✅ Facebook: facebook.com/VasilyTrading/
⭐ Get 100% Deposit Bonus: bit.ly/bestforexgoldbroker
Bài đăng liên quan
Thông báo miễn trừ trách nhiệm
Thông tin và các ấn phẩm này không nhằm mục đích, và không cấu thành, lời khuyên hoặc khuyến nghị về tài chính, đầu tư, giao dịch hay các loại khác do TradingView cung cấp hoặc xác nhận. Đọc thêm tại Điều khoản Sử dụng.