

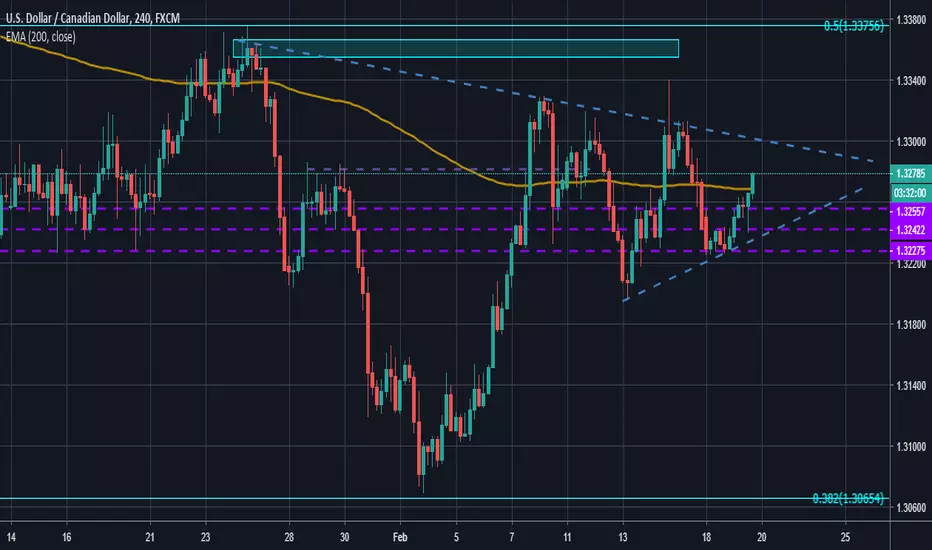
Price broke through the 200 day EMA and is moving towards the higher part of the wedge pattern we see forming. The way price is forming around the corner of the triangle reminds a bit of an inverse head and shoulders pattern.
For a bullish trade one should wait for a breakout of this pattern. In this case, the bullish movement would need to be strong and an entry around 1.3300 would be appropriate. You can also wait, see how strong the breakout is, and enter after the breakout and retest of the pattern. If price drops below 1.3200 or the 200EMA this trade would need to be closed as that could lead to a bearish decline. Especially if oil continues to climb.
For a bullish trade one should wait for a breakout of this pattern. In this case, the bullish movement would need to be strong and an entry around 1.3300 would be appropriate. You can also wait, see how strong the breakout is, and enter after the breakout and retest of the pattern. If price drops below 1.3200 or the 200EMA this trade would need to be closed as that could lead to a bearish decline. Especially if oil continues to climb.

Thông báo miễn trừ trách nhiệm
Thông tin và các ấn phẩm này không nhằm mục đích, và không cấu thành, lời khuyên hoặc khuyến nghị về tài chính, đầu tư, giao dịch hay các loại khác do TradingView cung cấp hoặc xác nhận. Đọc thêm tại Điều khoản Sử dụng.
Thông báo miễn trừ trách nhiệm
Thông tin và các ấn phẩm này không nhằm mục đích, và không cấu thành, lời khuyên hoặc khuyến nghị về tài chính, đầu tư, giao dịch hay các loại khác do TradingView cung cấp hoặc xác nhận. Đọc thêm tại Điều khoản Sử dụng.