

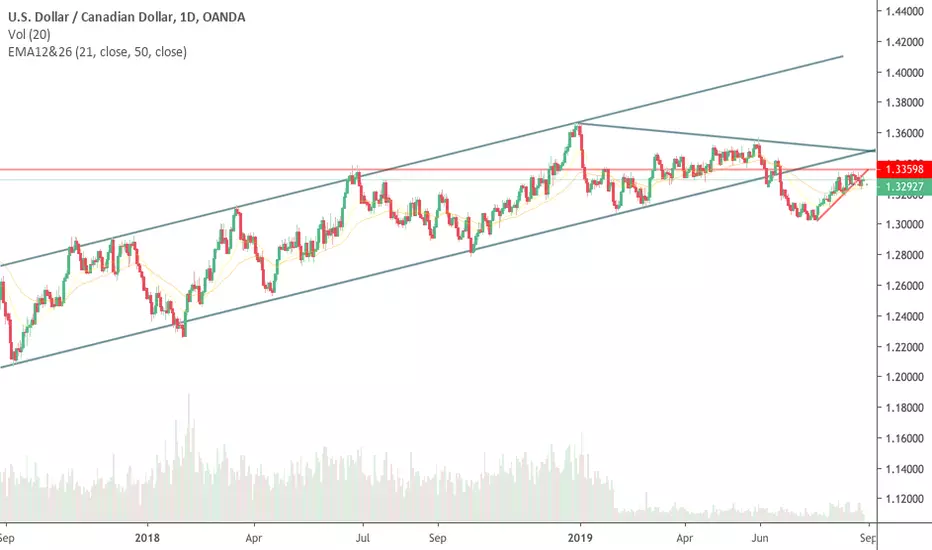
USD/CAD Weekly and Daily time frame broke out from its long term channel and making lower lows and lower highs, we already have a pull back after the breakout, you can spread your down fibonacci to get a clearer picture of the lower lows and lower highs,
if you spread your fibs on the Daily you will notice that we have a 0.618 pull back with a counter trend line break,
having all this facts makes it enough big of a case to consider looking for short trades.
now if you go down even further to the 4 hour chart, you will notice a volume spike with a small body candle and a long wick, which that indicates that a bog fight was happening at that level which adds more confirmation for a short trade.
In conclusion:
We Have
1)Weekly/Daily Channel Break
2)Lower Lows & Lower Highs
3)Daily 0.618 Pullback
4)Counter Trend Line Break
5)Volume Spike On The 4 Hr
P.s if you look at the monthly you will also notice that we have there a bearish candlestick formation and this was the test of the candle.
if you see anything different then what I saw please comment and let me know what is it that you see that I missed...
Thank You
Easy Trading To You All!!!
Ghi chú
1 more confirmation, on the 4 hr TF the market broke out from its little consolidation and pulled back
Thông báo miễn trừ trách nhiệm
Thông tin và các ấn phẩm này không nhằm mục đích, và không cấu thành, lời khuyên hoặc khuyến nghị về tài chính, đầu tư, giao dịch hay các loại khác do TradingView cung cấp hoặc xác nhận. Đọc thêm tại Điều khoản Sử dụng.
Thông báo miễn trừ trách nhiệm
Thông tin và các ấn phẩm này không nhằm mục đích, và không cấu thành, lời khuyên hoặc khuyến nghị về tài chính, đầu tư, giao dịch hay các loại khác do TradingView cung cấp hoặc xác nhận. Đọc thêm tại Điều khoản Sử dụng.