

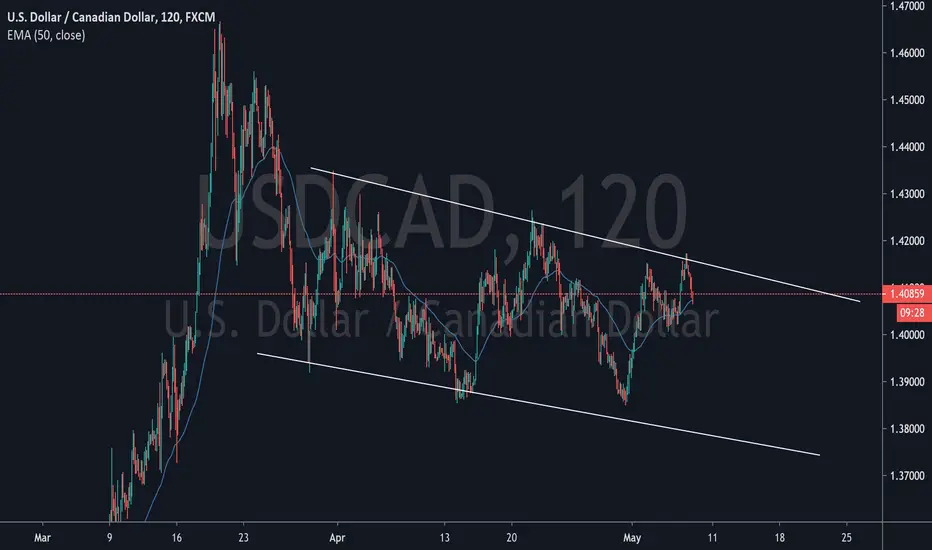
– Time = 2H
– Structure = Downtrend
– Pattern = Downtrend channel
– Tendency = Downtrend
– Monthly Candle retests Fibonacci resistance.
– 4hr Chart indicates an inverse hummer retested at the dynamic resistance level
– Price created a downtrend channel forming LH and LL.
– Hence the EMA 50 day is below the price, my analysis indicates a BEARISH MARKET
-----------------
Disclaimer: Forex trading and trading in other leveraged products involves a significant level of risk and is not suitable for all investors.
– Structure = Downtrend
– Pattern = Downtrend channel
– Tendency = Downtrend
– Monthly Candle retests Fibonacci resistance.
– 4hr Chart indicates an inverse hummer retested at the dynamic resistance level
– Price created a downtrend channel forming LH and LL.
– Hence the EMA 50 day is below the price, my analysis indicates a BEARISH MARKET
-----------------
Disclaimer: Forex trading and trading in other leveraged products involves a significant level of risk and is not suitable for all investors.
Đóng lệnh: đạt mục tiêu

Thông báo miễn trừ trách nhiệm
Thông tin và các ấn phẩm này không nhằm mục đích, và không cấu thành, lời khuyên hoặc khuyến nghị về tài chính, đầu tư, giao dịch hay các loại khác do TradingView cung cấp hoặc xác nhận. Đọc thêm tại Điều khoản Sử dụng.
Thông báo miễn trừ trách nhiệm
Thông tin và các ấn phẩm này không nhằm mục đích, và không cấu thành, lời khuyên hoặc khuyến nghị về tài chính, đầu tư, giao dịch hay các loại khác do TradingView cung cấp hoặc xác nhận. Đọc thêm tại Điều khoản Sử dụng.