

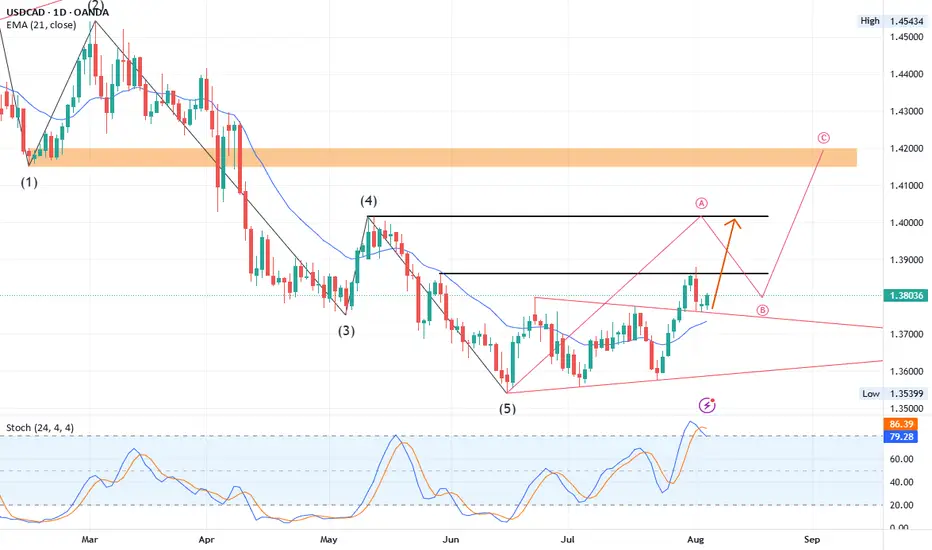
USDCAD has recently completed a clean 5-wave Elliott Wave decline, reaching a significant low at 1.3540 on June 16, 2025. This low marks the end of the bearish cycle, followed by an accumulation phase. During this phase, price formed a triple bottom pattern, confirming strong demand around the 1.3540–1.3560 zone.
The breakout above the neckline confirms this reversal pattern, and price is now retesting the previous resistance zone (1.3750–1.3770), which has turned into support.
The pair is also trading above the 21-period EMA, reinforcing the bullish momentum.
Elliott Wave & Structure Outlook
Elliott Wave count shows a completed 1–5 bearish wave, followed by a corrective bullish structure in progress.
Wave A of the corrective move has likely completed, and Wave B retracement is underway.
A continuation toward Wave C is expected, targeting the 1.4180–1.4300 resistance area, aligning with prior major supply zones.
Trade Plan
Buy Entry Zone: 1.3750 – 1.3700
Stop Loss: 1.3560 (below structure support and trendline)
Take Profit Targets:
🎯 TP1: 1.4000
🎯 TP2: 1.4180
🎯 TP3: 1.4300
USDCAD has shifted from a prolonged bearish trend into a bullish corrective phase. A successful retest of the breakout zone offers a high-probability long trade setup. Breakout and continuation toward 1.4180–1.4300 aligns with wave theory and technical resistance zones.
The breakout above the neckline confirms this reversal pattern, and price is now retesting the previous resistance zone (1.3750–1.3770), which has turned into support.
The pair is also trading above the 21-period EMA, reinforcing the bullish momentum.
Elliott Wave & Structure Outlook
Elliott Wave count shows a completed 1–5 bearish wave, followed by a corrective bullish structure in progress.
Wave A of the corrective move has likely completed, and Wave B retracement is underway.
A continuation toward Wave C is expected, targeting the 1.4180–1.4300 resistance area, aligning with prior major supply zones.
Trade Plan
Buy Entry Zone: 1.3750 – 1.3700
Stop Loss: 1.3560 (below structure support and trendline)
Take Profit Targets:
🎯 TP1: 1.4000
🎯 TP2: 1.4180
🎯 TP3: 1.4300
USDCAD has shifted from a prolonged bearish trend into a bullish corrective phase. A successful retest of the breakout zone offers a high-probability long trade setup. Breakout and continuation toward 1.4180–1.4300 aligns with wave theory and technical resistance zones.

Thông báo miễn trừ trách nhiệm
Thông tin và các ấn phẩm này không nhằm mục đích, và không cấu thành, lời khuyên hoặc khuyến nghị về tài chính, đầu tư, giao dịch hay các loại khác do TradingView cung cấp hoặc xác nhận. Đọc thêm tại Điều khoản Sử dụng.
Thông báo miễn trừ trách nhiệm
Thông tin và các ấn phẩm này không nhằm mục đích, và không cấu thành, lời khuyên hoặc khuyến nghị về tài chính, đầu tư, giao dịch hay các loại khác do TradingView cung cấp hoặc xác nhận. Đọc thêm tại Điều khoản Sử dụng.