

🔎 Technical Breakdown
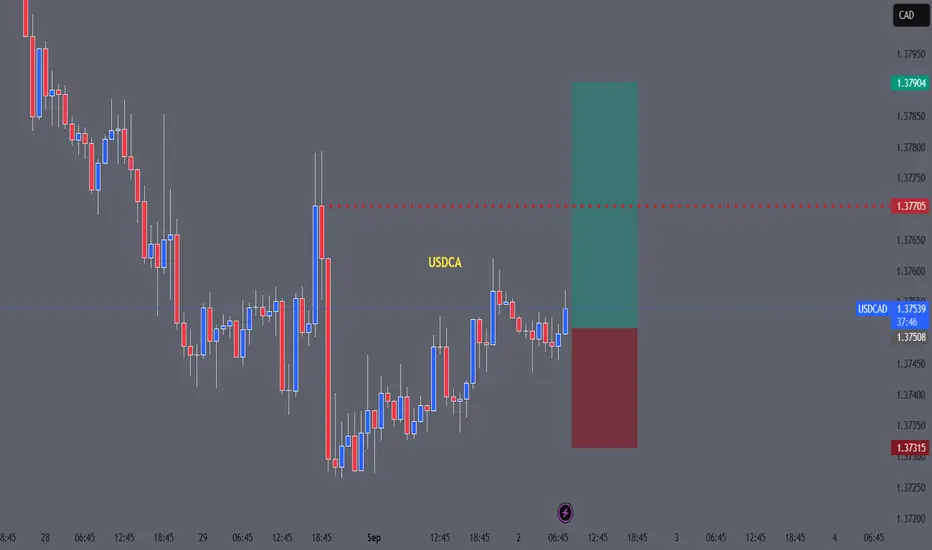
Breakout Structure
Price had been consolidating in a sideways range after a strong downtrend.
Recently, price broke out of the consolidation zone to the upside, showing buyers stepping in.
Current candles are forming higher lows → early trend reversal signals.
Support Zone (Demand Area)
Around 1.3730–1.3740, price rejected multiple times (wicks).
This shows strong demand, making it a safe stop-loss zone.
Candle Behavior
Recent bullish candles have longer bodies and smaller wicks → momentum favors buyers.
The last red candles got quickly engulfed by blue (bullish) candles → market bias shifted.
Risk-to-Reward (RRR)
SL around 1.3731 and TP1 at 1.3770 / TP2 1.3790 gives you nearly a 1:2 RRR, which is favorable.
Market Context
USDCAD often reacts strongly to oil price moves and USD strength. If USD is stable/strong, buying pressure supports this setup.
Also, this looks like a retracement entry after a sell-off, catching the early reversal
PS - STILL BEARISH IN DAILY TF
Breakout Structure
Price had been consolidating in a sideways range after a strong downtrend.
Recently, price broke out of the consolidation zone to the upside, showing buyers stepping in.
Current candles are forming higher lows → early trend reversal signals.
Support Zone (Demand Area)
Around 1.3730–1.3740, price rejected multiple times (wicks).
This shows strong demand, making it a safe stop-loss zone.
Candle Behavior
Recent bullish candles have longer bodies and smaller wicks → momentum favors buyers.
The last red candles got quickly engulfed by blue (bullish) candles → market bias shifted.
Risk-to-Reward (RRR)
SL around 1.3731 and TP1 at 1.3770 / TP2 1.3790 gives you nearly a 1:2 RRR, which is favorable.
Market Context
USDCAD often reacts strongly to oil price moves and USD strength. If USD is stable/strong, buying pressure supports this setup.
Also, this looks like a retracement entry after a sell-off, catching the early reversal
PS - STILL BEARISH IN DAILY TF

Thông báo miễn trừ trách nhiệm
Thông tin và các ấn phẩm này không nhằm mục đích, và không cấu thành, lời khuyên hoặc khuyến nghị về tài chính, đầu tư, giao dịch hay các loại khác do TradingView cung cấp hoặc xác nhận. Đọc thêm tại Điều khoản Sử dụng.
Thông báo miễn trừ trách nhiệm
Thông tin và các ấn phẩm này không nhằm mục đích, và không cấu thành, lời khuyên hoặc khuyến nghị về tài chính, đầu tư, giao dịch hay các loại khác do TradingView cung cấp hoặc xác nhận. Đọc thêm tại Điều khoản Sử dụng.