

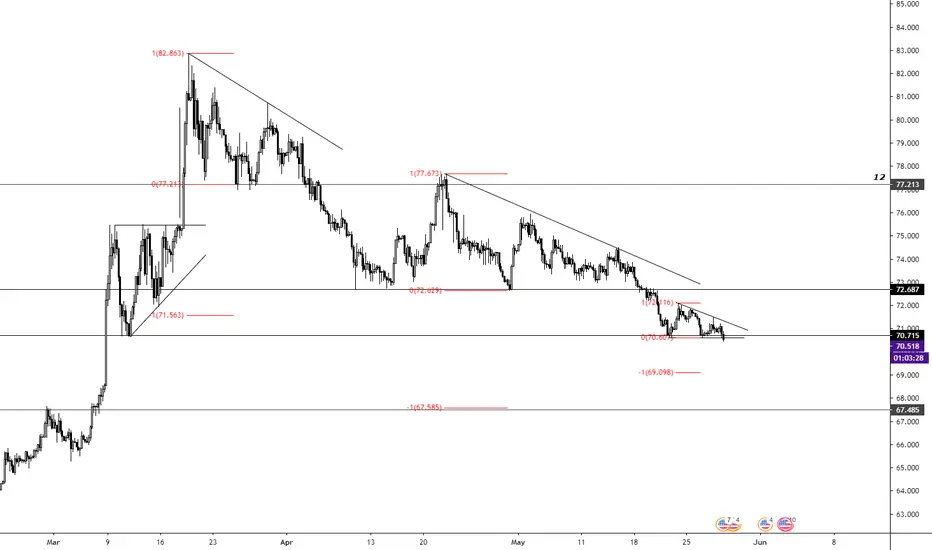
USD has been in a bear trend against ruble since March, it formed a topping pattern as a descending triangle and started a bear trend. since then it made another defending triangle as a bearish continuation pattern and broke down from it the target of that large triangle is around 68$. its currently completing another small descending triangle with a target around 69$. this chart is a beauty , triangle inception :D.
the next technical support area on this chart is around 67.5$, also there is a gap around 68.5 which matches the target of the triangles.
these technical setups together increase the chance of the price to hit those price targets so this setup can provide good risk to reward high probability trade.
you can manage your risk around 71.5 and go short if we confirm a candle below the small triangle.
the next technical support area on this chart is around 67.5$, also there is a gap around 68.5 which matches the target of the triangles.
these technical setups together increase the chance of the price to hit those price targets so this setup can provide good risk to reward high probability trade.
you can manage your risk around 71.5 and go short if we confirm a candle below the small triangle.
Ghi chú
Ghi chú
It's acting according to the plan so far, broke the triangle to the downside, retested it as resistant. And it's about to hit the first target around 69 =))
Ghi chú
Ghi chú
the first target got hit. you can take some profit off the table here and let the rest run to the 2nd target lvl around 67.5 - 68
Ghi chú
scaling out of this trade.Đóng lệnh: đạt mục tiêu
Ghi chú
+3R
Thông báo miễn trừ trách nhiệm
Thông tin và các ấn phẩm này không nhằm mục đích, và không cấu thành, lời khuyên hoặc khuyến nghị về tài chính, đầu tư, giao dịch hay các loại khác do TradingView cung cấp hoặc xác nhận. Đọc thêm tại Điều khoản Sử dụng.
Thông báo miễn trừ trách nhiệm
Thông tin và các ấn phẩm này không nhằm mục đích, và không cấu thành, lời khuyên hoặc khuyến nghị về tài chính, đầu tư, giao dịch hay các loại khác do TradingView cung cấp hoặc xác nhận. Đọc thêm tại Điều khoản Sử dụng.