
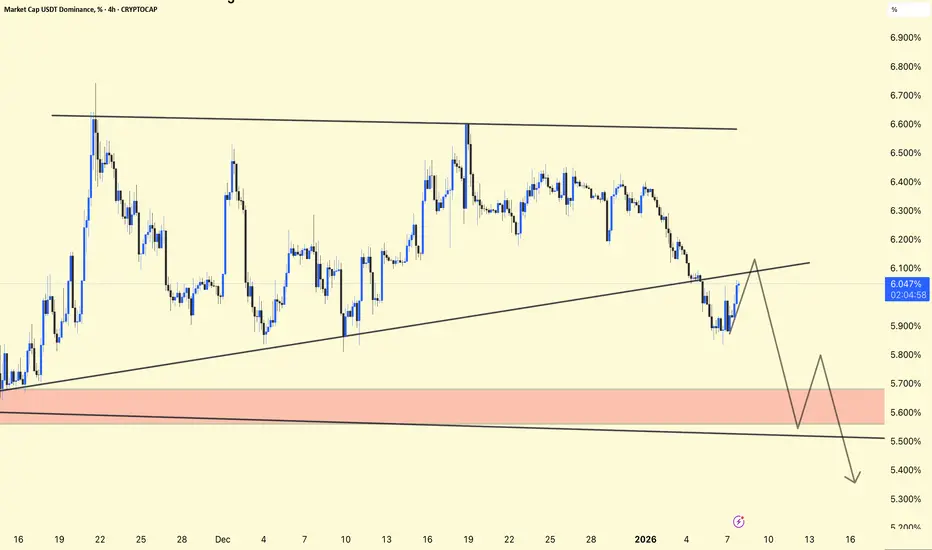
USDT Dominance – Chart Update
USDT.D is currently holding an ascending trendline support
A short-term bounce or pullback is possible from this area
Overall structure still shows a bearish bias
Resistance: 6.10% – 6.20%
Major Support / Demand Zone: 5.60% – 5.55%
Rejection from 6.10–6.20% → Positive for altcoins
Break and hold above resistance → Market may turn risk-off short term
USDT Dominance is gradually showing downside pressure.
A clean breakdown below 5.60% could signal a strong altcoin rally.
For educational purposes only. Not financial advice.

Bài đăng liên quan
Thông báo miễn trừ trách nhiệm
Thông tin và các ấn phẩm này không nhằm mục đích, và không cấu thành, lời khuyên hoặc khuyến nghị về tài chính, đầu tư, giao dịch hay các loại khác do TradingView cung cấp hoặc xác nhận. Đọc thêm tại Điều khoản Sử dụng.
Bài đăng liên quan
Thông báo miễn trừ trách nhiệm
Thông tin và các ấn phẩm này không nhằm mục đích, và không cấu thành, lời khuyên hoặc khuyến nghị về tài chính, đầu tư, giao dịch hay các loại khác do TradingView cung cấp hoặc xác nhận. Đọc thêm tại Điều khoản Sử dụng.