
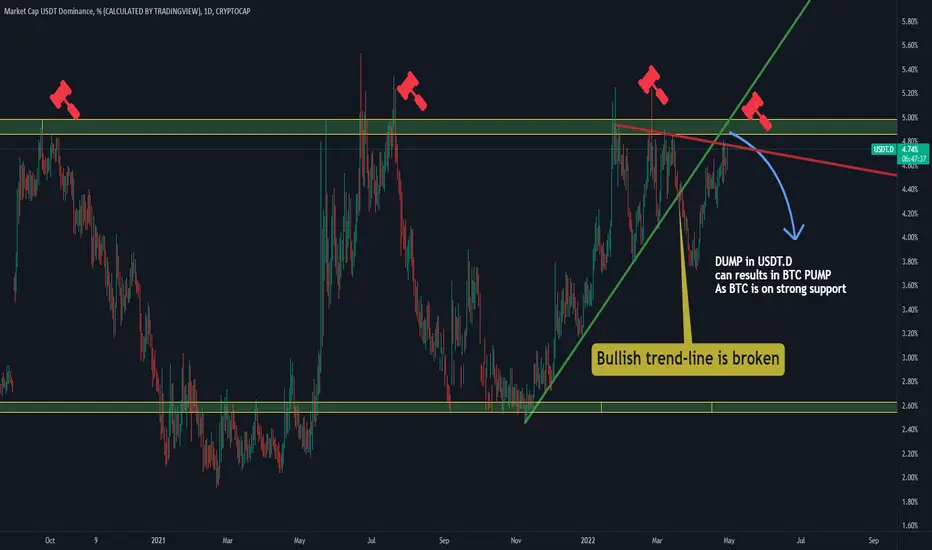
I was looking at USDT dominance (1D time-frame), and just found interesting signals 🌞
1. USDT.D has broken the green bullish trend-line and now is on a bearish move.
2. It is being rejected after it has reached the red trend-line as a dynamic resistance area .
3. The static resistance above is a strong long-term resistance area that is rejecting the USDT.D
What I personally conclude from these 3 signals, is that there is a high possibility that USDT.D will start a strong down-trend. And as the Bitcoin is on a strong support area as well, it can help the Bitcoin PUMP!
Feel free to let me know about your ideas or any questions you got in comment section.
Ghi chú
Time is running our for USDT. 12H.The bulls are getting weaker and weaker. When the yellow trend-line is broken, there is high chance for BTC to pump.
-----------------------------------------------------
This is another view in 1H time-frame

Bài đăng liên quan
Thông báo miễn trừ trách nhiệm
Thông tin và các ấn phẩm này không nhằm mục đích, và không cấu thành, lời khuyên hoặc khuyến nghị về tài chính, đầu tư, giao dịch hay các loại khác do TradingView cung cấp hoặc xác nhận. Đọc thêm tại Điều khoản Sử dụng.
Bài đăng liên quan
Thông báo miễn trừ trách nhiệm
Thông tin và các ấn phẩm này không nhằm mục đích, và không cấu thành, lời khuyên hoặc khuyến nghị về tài chính, đầu tư, giao dịch hay các loại khác do TradingView cung cấp hoặc xác nhận. Đọc thêm tại Điều khoản Sử dụng.