
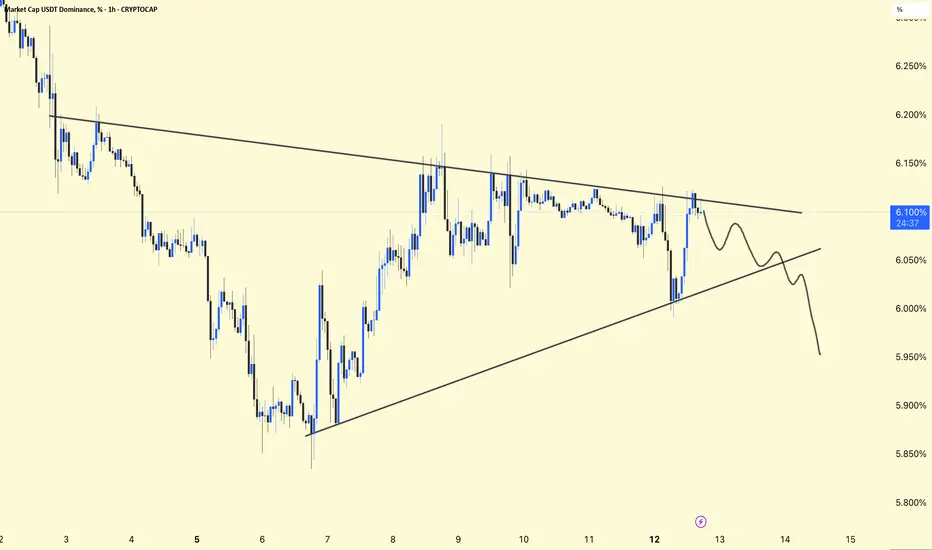
USDT Dominance (1H) – Chart Update
USDT.D is trading inside a symmetrical triangle, formed by a descending resistance and rising support — indicating market indecision.
Price is hovering near the upper half of the pattern, facing rejection from the descending trendline around 6.10–6.15%.
Likely move toward the rising support, which would favor risk-on sentiment and support altcoins.
Signals risk-off, increasing chances of market pullback.
Confirms capital rotation into crypto, bullish for BTC & alts.
USDT.D is at a decision point. A confirmed breakout or breakdown will define the next short-term direction for the broader crypto market. Risk management is key until clarity emerges.
USDT.D is trading inside a symmetrical triangle, formed by a descending resistance and rising support — indicating market indecision.
Price is hovering near the upper half of the pattern, facing rejection from the descending trendline around 6.10–6.15%.
Likely move toward the rising support, which would favor risk-on sentiment and support altcoins.
Signals risk-off, increasing chances of market pullback.
Confirms capital rotation into crypto, bullish for BTC & alts.
USDT.D is at a decision point. A confirmed breakout or breakdown will define the next short-term direction for the broader crypto market. Risk management is key until clarity emerges.
Ghi chú
Giao dịch đang hoạt động

Bài đăng liên quan
Thông báo miễn trừ trách nhiệm
Thông tin và các ấn phẩm này không nhằm mục đích, và không cấu thành, lời khuyên hoặc khuyến nghị về tài chính, đầu tư, giao dịch hay các loại khác do TradingView cung cấp hoặc xác nhận. Đọc thêm tại Điều khoản Sử dụng.
Bài đăng liên quan
Thông báo miễn trừ trách nhiệm
Thông tin và các ấn phẩm này không nhằm mục đích, và không cấu thành, lời khuyên hoặc khuyến nghị về tài chính, đầu tư, giao dịch hay các loại khác do TradingView cung cấp hoặc xác nhận. Đọc thêm tại Điều khoản Sử dụng.