
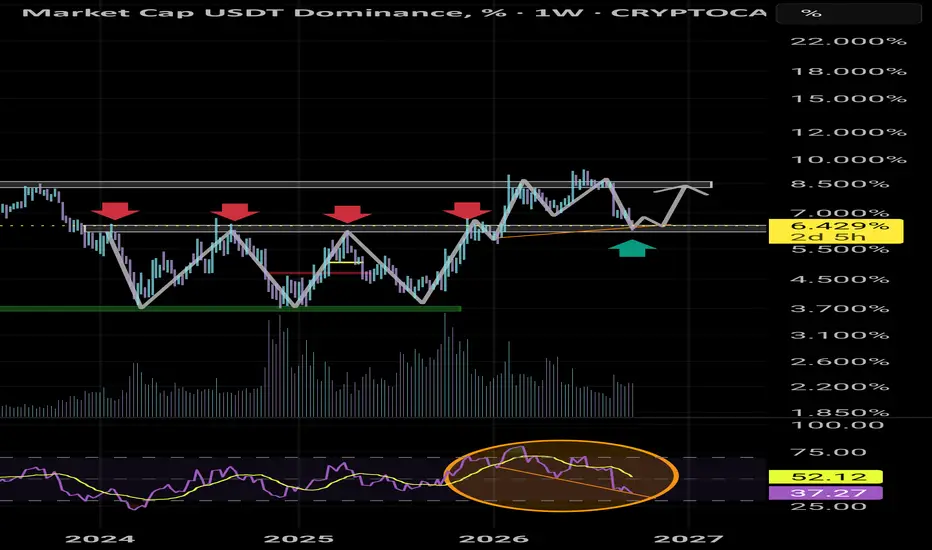
As we can see on the weekly chart we are pulling back to the area that counted as resistance 4 times as marked on the chart previously when USDT.D was below it.
Also weekly RSI is putting in lower lows and price is putting in higher lows which is a bullish divergence and we can't ignore it since the time frame is a Weekly chart. There is no way we'll be breaking a support which counted as resistance 4 times before.
My guess is that we'll have some consolidation or maybe a fake breakdown before shooting back up to the higher area marked on the chart. In my opinion a very big crash will happen soon.
Invalidation is if we break the current weekly support and close below it and only then the bull market will start and that's when I'll enter into BTC and ETH.
DYOR
Goodluck
Also weekly RSI is putting in lower lows and price is putting in higher lows which is a bullish divergence and we can't ignore it since the time frame is a Weekly chart. There is no way we'll be breaking a support which counted as resistance 4 times before.
My guess is that we'll have some consolidation or maybe a fake breakdown before shooting back up to the higher area marked on the chart. In my opinion a very big crash will happen soon.
Invalidation is if we break the current weekly support and close below it and only then the bull market will start and that's when I'll enter into BTC and ETH.
DYOR
Goodluck

Thông báo miễn trừ trách nhiệm
Thông tin và các ấn phẩm này không nhằm mục đích, và không cấu thành, lời khuyên hoặc khuyến nghị về tài chính, đầu tư, giao dịch hay các loại khác do TradingView cung cấp hoặc xác nhận. Đọc thêm tại Điều khoản Sử dụng.
Thông báo miễn trừ trách nhiệm
Thông tin và các ấn phẩm này không nhằm mục đích, và không cấu thành, lời khuyên hoặc khuyến nghị về tài chính, đầu tư, giao dịch hay các loại khác do TradingView cung cấp hoặc xác nhận. Đọc thêm tại Điều khoản Sử dụng.