
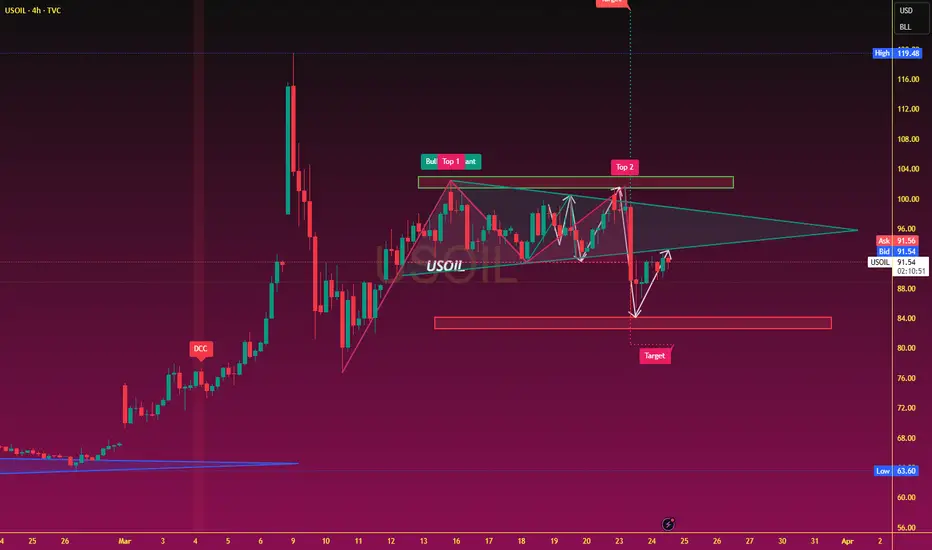
From a technical perspective, the daily chart structure indicates that—following a rapid surge to a peak—oil prices have formed a temporary top. Subsequently, driven by news-related shocks, the market witnessed a high-volume "long bearish candle," signaling a shift in the short-term trend from strength to weakness. The current key support level is situated near $85; a breach of this level could lead to a further decline toward the $80 region. Conversely, overhead resistance is concentrated around the $95 mark, acting as a significant cap on prices in the short term. In terms of momentum indicators, the daily-level RSI has retreated rapidly from overbought territory, suggesting a significant waning of bullish momentum. The current rebound appears to be primarily a technical correction, and the market is likely to continue its volatile, downward-biased trajectory. Furthermore, the MACD indicator is expanding below the zero line, further reinforcing the downside risks in the short term.

Thông báo miễn trừ trách nhiệm
Thông tin và các ấn phẩm này không nhằm mục đích, và không cấu thành, lời khuyên hoặc khuyến nghị về tài chính, đầu tư, giao dịch hay các loại khác do TradingView cung cấp hoặc xác nhận. Đọc thêm tại Điều khoản Sử dụng.
Thông báo miễn trừ trách nhiệm
Thông tin và các ấn phẩm này không nhằm mục đích, và không cấu thành, lời khuyên hoặc khuyến nghị về tài chính, đầu tư, giao dịch hay các loại khác do TradingView cung cấp hoặc xác nhận. Đọc thêm tại Điều khoản Sử dụng.