
Monthly chart already Published
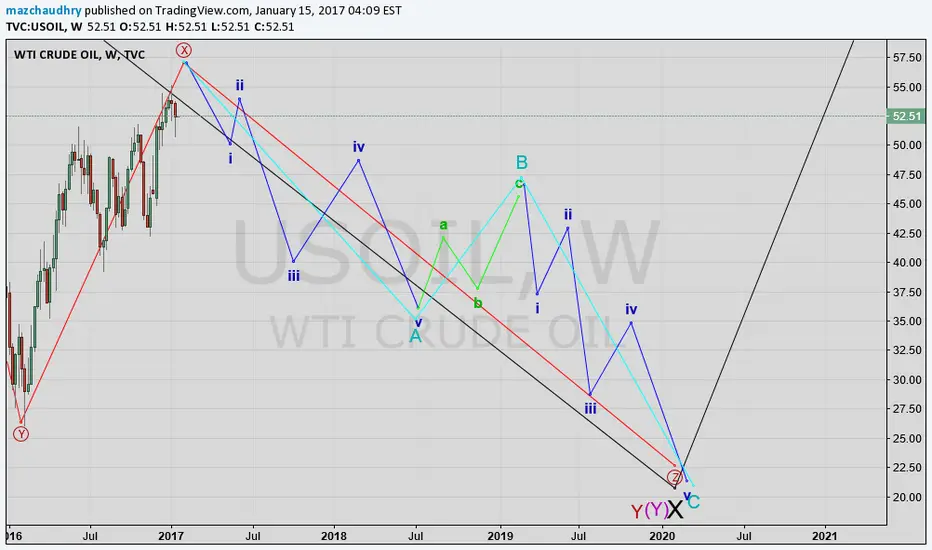
Here is my Weekly chart with Bit more explaining the short wave .
Short From 56.50 till 20.00 will be in ABC Formation ( As it is a Corrective Pattern )
Further division of ABC as bellow :
A= 12345
B= abc
C = 12345
Trade Plan ::
Lets wait for the Completion of X at 56.50
I will wait for (i)of A to complete
(ii) of A will be a Pullback there after a Congestion
I am going to enter into short trade at start of (iii)of A
many happy green pips to you all
Elliot Wave By mazchaudhry
Trade at your own Risk .

Bài đăng liên quan
Thông báo miễn trừ trách nhiệm
Thông tin và các ấn phẩm này không nhằm mục đích, và không cấu thành, lời khuyên hoặc khuyến nghị về tài chính, đầu tư, giao dịch hay các loại khác do TradingView cung cấp hoặc xác nhận. Đọc thêm tại Điều khoản Sử dụng.
Bài đăng liên quan
Thông báo miễn trừ trách nhiệm
Thông tin và các ấn phẩm này không nhằm mục đích, và không cấu thành, lời khuyên hoặc khuyến nghị về tài chính, đầu tư, giao dịch hay các loại khác do TradingView cung cấp hoặc xác nhận. Đọc thêm tại Điều khoản Sử dụng.