
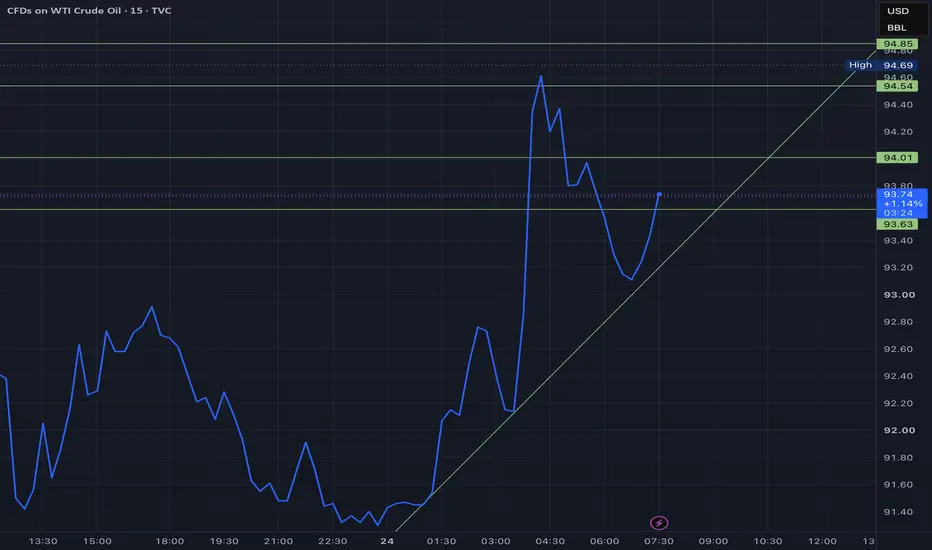
This is what the mornings radar for USOIL looks like. $93.63 is a crucial monthly support level for this Fibonacci Volatility Cipher. Bouncing above the line. Looks very bullish. These price levels are long-term, and this chart is long-term. $200 is completely reasonable under this financial model. If you zoom out and look upwards on the chart, you will cleanly notice monthly steps upwards that are expected to gain logarithmically for the next cycle.
Ghi chú
Bullseye!Ghi chú
Two bulls to one bear ratio atm. Internal votes say the price continues to move up.
Thông báo miễn trừ trách nhiệm
Thông tin và các ấn phẩm này không nhằm mục đích, và không cấu thành, lời khuyên hoặc khuyến nghị về tài chính, đầu tư, giao dịch hay các loại khác do TradingView cung cấp hoặc xác nhận. Đọc thêm tại Điều khoản Sử dụng.
Thông báo miễn trừ trách nhiệm
Thông tin và các ấn phẩm này không nhằm mục đích, và không cấu thành, lời khuyên hoặc khuyến nghị về tài chính, đầu tư, giao dịch hay các loại khác do TradingView cung cấp hoặc xác nhận. Đọc thêm tại Điều khoản Sử dụng.