
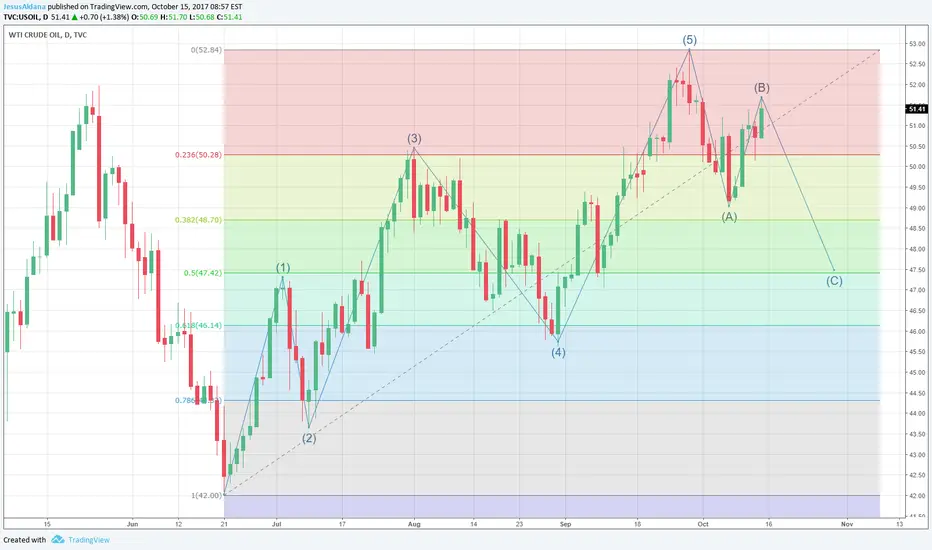
On a daily chart WTI has performed under an Elliot Wave Pattern since July. It's final trend wave ended on late September with help of OPEP statment of commitment to current output and Turkey's threat to cut oil production.
Since then bears have taken control in Oil industry. Wave A managed to touch Fibbonaci 38% level before entering wave B. Although we can't confirm at this stage final price of Wave B since it needs to show some red candles. As for now prices can still go further up and break $53 level.
However if this doesn't occure this week. Prices are projected in a downtrend forming Wave C. Most optimistic scenario would be Fibonacci 50% at $47.50.
For more analysis visit investing.com/members/200755314
Giao dịch đang hoạt động
Red candles starting to bundle
Thông báo miễn trừ trách nhiệm
Thông tin và các ấn phẩm này không nhằm mục đích, và không cấu thành, lời khuyên hoặc khuyến nghị về tài chính, đầu tư, giao dịch hay các loại khác do TradingView cung cấp hoặc xác nhận. Đọc thêm tại Điều khoản Sử dụng.
Thông báo miễn trừ trách nhiệm
Thông tin và các ấn phẩm này không nhằm mục đích, và không cấu thành, lời khuyên hoặc khuyến nghị về tài chính, đầu tư, giao dịch hay các loại khác do TradingView cung cấp hoặc xác nhận. Đọc thêm tại Điều khoản Sử dụng.