
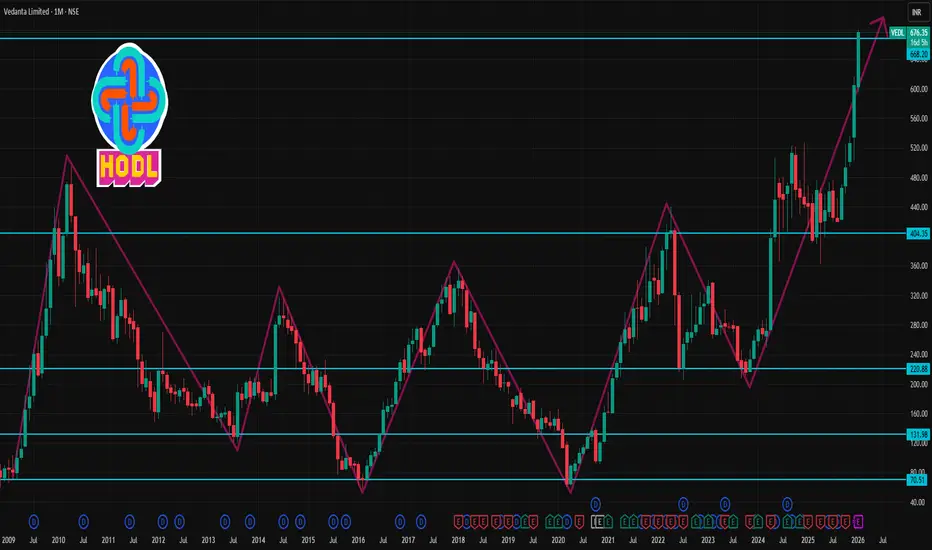
📌 Latest Market Context
• The stock is trading near multi‑month and all‑time highs (around ₹670+ on NSE) on strong momentum and positive sentiment after broker upgrades and structural catalysts.
• RSI readings suggest strong upside momentum but near overbought in some sources.
📈 1‑Month Timeframe Key Levels
(These combine pivot, swing support/resistance & recent price action ranges)
Resistance (Upside Targets)
₹656–₹660 — Upper daily pivot resistance zone.
₹650–₹656 — R2–R3 levels from technical pivot indicators.
Above ₹670–₹680 — Near current multi‑week highs / psychological zone (strong breakout if sustained).
Support (Downside Floors)
₹630–₹635 — Immediate pivot support (~S1) & short‑term cushion.
₹622–₹625 — Secondary demand zone near moving average clusters.
₹616–₹620 — Deeper swing support if short correction unfolds.
📊 What These Levels Mean
✅ Holding Above ₹630–₹635
Maintains bullish momentum in the 1‑month view.
Prospects for retesting ₹650+ and potentially ₹670–₹680 if buying continues.
⚠️ Break Below ₹620
Could open a pullback toward ₹616 and lower pivot zones before buyers re‑emerge.
A close below ~₹616 on monthly/daily charts may signal short‑term loss of structure.
📍 How to Use These Levels
Bullish Trade Setup (1M swing)
Buy or add near support ₹630–₹620 with stops slightly below ₹616
Targets: ₹650 → ₹670+
Neutral/Profit‑Taking Zone
₹650–₹670+ is the next potential resistance breakeven/exit zone
Bearish/Defensive
If price decisively closes below ₹620–₹616, reduce risk exposure and watch for support at lower levels.

Contact Knowledgehub for a detailed consultation: Dm on WhatsApp: [wa.link/a2o0kz]-
Phone No: [+91 93102 26243]-
Email: [tradingviewknowledgehub@gmail.com]---
-- Let’s achieve success together!
Phone No: [+91 93102 26243]-
Email: [tradingviewknowledgehub@gmail.com]---
-- Let’s achieve success together!
Bài đăng liên quan
Thông báo miễn trừ trách nhiệm
Thông tin và các ấn phẩm này không nhằm mục đích, và không cấu thành, lời khuyên hoặc khuyến nghị về tài chính, đầu tư, giao dịch hay các loại khác do TradingView cung cấp hoặc xác nhận. Đọc thêm tại Điều khoản Sử dụng.