Cập nhật
VeChain At The Key Support
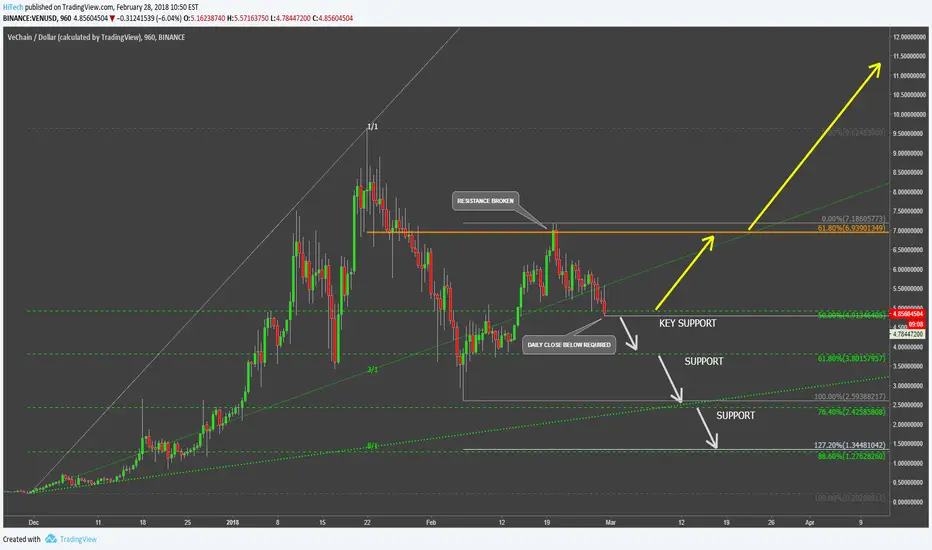
VeChain has reached the all-time high at $9.6, after which it corrected down to $2.6, losing 73% to the USD. Price failed to break with confidence below 61.8% Fibonacci retracement levels at $3.8 and below the 3/1 Gann Fan trendline, although it produced spikes lower.
After reaching the low at $2.6, VeChain recovered reaching the $7.1, and managed to break above the 61.8% Fibonacci retracement level, suggesting the validity of the uptrend. But now, VEN/USD is trading at the key support area, and the daily close below $4.7 would confirm the support and the Gann Fann trendline breakout. In this case, the price is likely to move down once again towards either $3.8, $2.4 or $1.27 support levels.
However if VeChain will avoid daily close below $4.7, the price could continue moving higher and potentially hit the $10 psychological resistance level. In any case, the major trend is up, but the risk of further correction down remains.
After reaching the low at $2.6, VeChain recovered reaching the $7.1, and managed to break above the 61.8% Fibonacci retracement level, suggesting the validity of the uptrend. But now, VEN/USD is trading at the key support area, and the daily close below $4.7 would confirm the support and the Gann Fann trendline breakout. In this case, the price is likely to move down once again towards either $3.8, $2.4 or $1.27 support levels.
However if VeChain will avoid daily close below $4.7, the price could continue moving higher and potentially hit the $10 psychological resistance level. In any case, the major trend is up, but the risk of further correction down remains.
Ghi chú
Daily close was below support, further decline becomes more likelyĐóng lệnh: đạt mục tiêu

Thông báo miễn trừ trách nhiệm
Thông tin và các ấn phẩm này không nhằm mục đích, và không cấu thành, lời khuyên hoặc khuyến nghị về tài chính, đầu tư, giao dịch hay các loại khác do TradingView cung cấp hoặc xác nhận. Đọc thêm tại Điều khoản Sử dụng.
Thông báo miễn trừ trách nhiệm
Thông tin và các ấn phẩm này không nhằm mục đích, và không cấu thành, lời khuyên hoặc khuyến nghị về tài chính, đầu tư, giao dịch hay các loại khác do TradingView cung cấp hoặc xác nhận. Đọc thêm tại Điều khoản Sử dụng.