
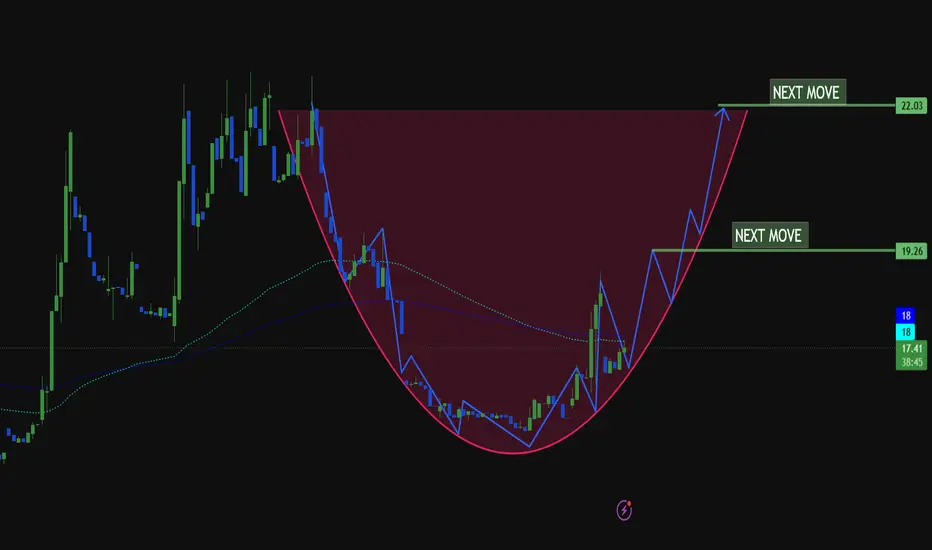
Bullish Cup-and-Recovery Pattern Points to Potential Rally Toward Key Resistance Levels
Description:
After experiencing a prolonged decline from the highlighted supply zone, price established a rounded bottom formation, creating a classic cup-and-recovery structure that often signals a shift from bearish pressure to bullish momentum. The steady accumulation near the lows suggests that sellers are losing control while buyers gradually step back into the market.
Price has successfully rebounded from the base of the pattern and is now trading above the recent swing lows, forming a sequence of higher highs and higher lows. This improving market structure indicates growing bullish strength and increases the probability of a continuation toward higher resistance levels.
The first major upside target is located around 19.26, where price may encounter temporary profit-taking or consolidation. A decisive break and close above this resistance would confirm further bullish continuation and expose the next significant target near 22.03, which aligns with the upper boundary of the previous supply zone.
The highlighted resistance area remains the key obstacle for buyers. If momentum continues to build and price breaks above this zone, it could trigger an accelerated move driven by breakout traders and short-covering activity. Until then, traders should monitor price action closely for confirmation signals as the market approaches these critical levels.
Overall, the chart structure favors a bullish outlook, with the rounded recovery pattern suggesting that the current advance may be the beginning of a larger trend reversal rather than a temporary corrective bounce.
Description:
After experiencing a prolonged decline from the highlighted supply zone, price established a rounded bottom formation, creating a classic cup-and-recovery structure that often signals a shift from bearish pressure to bullish momentum. The steady accumulation near the lows suggests that sellers are losing control while buyers gradually step back into the market.
Price has successfully rebounded from the base of the pattern and is now trading above the recent swing lows, forming a sequence of higher highs and higher lows. This improving market structure indicates growing bullish strength and increases the probability of a continuation toward higher resistance levels.
The first major upside target is located around 19.26, where price may encounter temporary profit-taking or consolidation. A decisive break and close above this resistance would confirm further bullish continuation and expose the next significant target near 22.03, which aligns with the upper boundary of the previous supply zone.
The highlighted resistance area remains the key obstacle for buyers. If momentum continues to build and price breaks above this zone, it could trigger an accelerated move driven by breakout traders and short-covering activity. Until then, traders should monitor price action closely for confirmation signals as the market approaches these critical levels.
Overall, the chart structure favors a bullish outlook, with the rounded recovery pattern suggesting that the current advance may be the beginning of a larger trend reversal rather than a temporary corrective bounce.

Bài đăng liên quan
Thông báo miễn trừ trách nhiệm
Thông tin và các ấn phẩm này không nhằm mục đích, và không cấu thành, lời khuyên hoặc khuyến nghị về tài chính, đầu tư, giao dịch hay các loại khác do TradingView cung cấp hoặc xác nhận. Đọc thêm tại Điều khoản Sử dụng.
Bài đăng liên quan
Thông báo miễn trừ trách nhiệm
Thông tin và các ấn phẩm này không nhằm mục đích, và không cấu thành, lời khuyên hoặc khuyến nghị về tài chính, đầu tư, giao dịch hay các loại khác do TradingView cung cấp hoặc xác nhận. Đọc thêm tại Điều khoản Sử dụng.