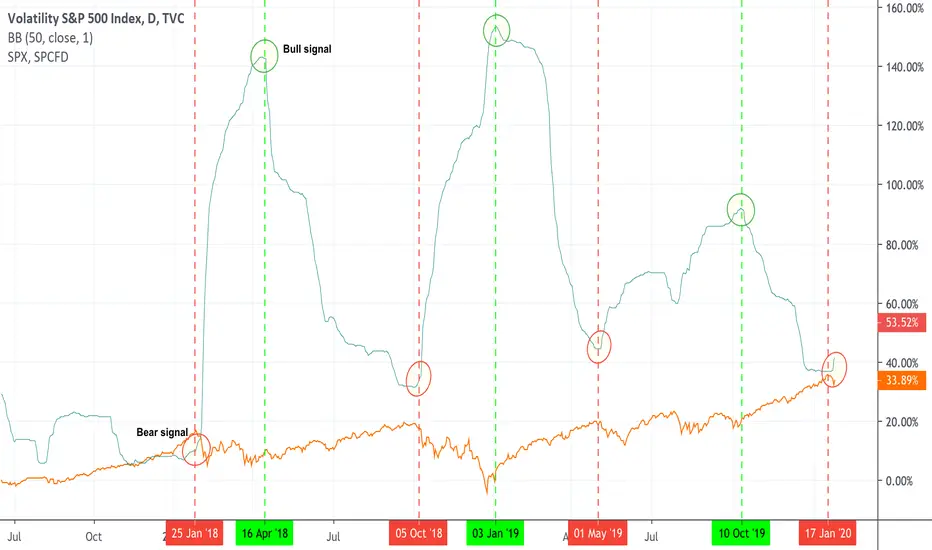
I follow a CFA from Charles Schwab, who uses this signal to establish negative or positive sentiment. To notice how it worked in the past, I have added the S&P500 trend line.
The idea is as follows:
When the upper Bollinger Band (with a 50 period and 1 standard deviation) on the VIX turns higher, that is a bearish sign, and when it turns lower, the SPY tends to rally.
-----------
Also, today January 28th, we had a Hindenburg Omen flash.
The idea is as follows:
When the upper Bollinger Band (with a 50 period and 1 standard deviation) on the
VIX turns higher, that is a bearish sign, and when it turns lower, the SPY tends to rally.-----------
Also, today January 28th, we had a Hindenburg Omen flash.

Thông báo miễn trừ trách nhiệm
Thông tin và các ấn phẩm này không nhằm mục đích, và không cấu thành, lời khuyên hoặc khuyến nghị về tài chính, đầu tư, giao dịch hay các loại khác do TradingView cung cấp hoặc xác nhận. Đọc thêm tại Điều khoản Sử dụng.
Thông báo miễn trừ trách nhiệm
Thông tin và các ấn phẩm này không nhằm mục đích, và không cấu thành, lời khuyên hoặc khuyến nghị về tài chính, đầu tư, giao dịch hay các loại khác do TradingView cung cấp hoặc xác nhận. Đọc thêm tại Điều khoản Sử dụng.