
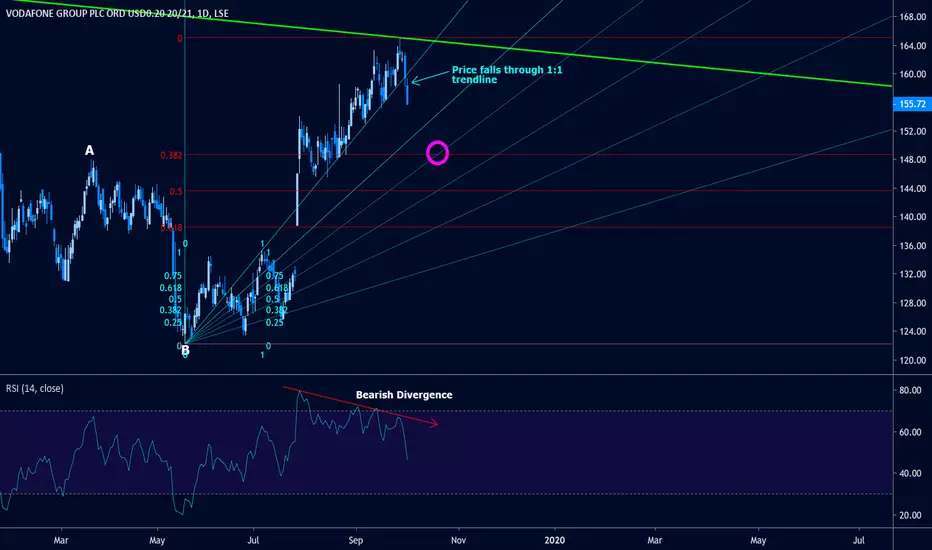
Vodafone ran into a solid confluence zone of resistance in Friday. It has since retraced over 5%. Today it fell over 2.3% and, crucially, it fell below the 1:1 trendline on the Fibonacci Fan shown. This is important because this trendline has acted as the greatest source of support throughout this uptrend. In addition, there has been a bearish divergence on the RSI since August 21st. The resistance was also provided by a 1.618 extension of the range between points A and B (not shown).
As far as targetting how far the market MAY go, the strength of resistance indicates there's a good chance the market will retrace to the 0.382 level or more. Note that this is one of the strongest horizontal price barriers on this chart. If the market reaches the 0.382 level, it could do so at a point of intersection with another diagonal price barrier such as the example in the pink circle where the 0.75 fan line intersects the 0.382 level.
Equally, breaking through this level to the downside would be a sign of strength in the downward pressure. If the market reaches this level, watch how the price behaves around the level. It will leave very important clues.
As far as targetting how far the market MAY go, the strength of resistance indicates there's a good chance the market will retrace to the 0.382 level or more. Note that this is one of the strongest horizontal price barriers on this chart. If the market reaches the 0.382 level, it could do so at a point of intersection with another diagonal price barrier such as the example in the pink circle where the 0.75 fan line intersects the 0.382 level.
Equally, breaking through this level to the downside would be a sign of strength in the downward pressure. If the market reaches this level, watch how the price behaves around the level. It will leave very important clues.

Thông báo miễn trừ trách nhiệm
Thông tin và các ấn phẩm này không nhằm mục đích, và không cấu thành, lời khuyên hoặc khuyến nghị về tài chính, đầu tư, giao dịch hay các loại khác do TradingView cung cấp hoặc xác nhận. Đọc thêm tại Điều khoản Sử dụng.
Thông báo miễn trừ trách nhiệm
Thông tin và các ấn phẩm này không nhằm mục đích, và không cấu thành, lời khuyên hoặc khuyến nghị về tài chính, đầu tư, giao dịch hay các loại khác do TradingView cung cấp hoặc xác nhận. Đọc thêm tại Điều khoản Sử dụng.