
VOLATILITY 75 INDEX – BUY Analysis
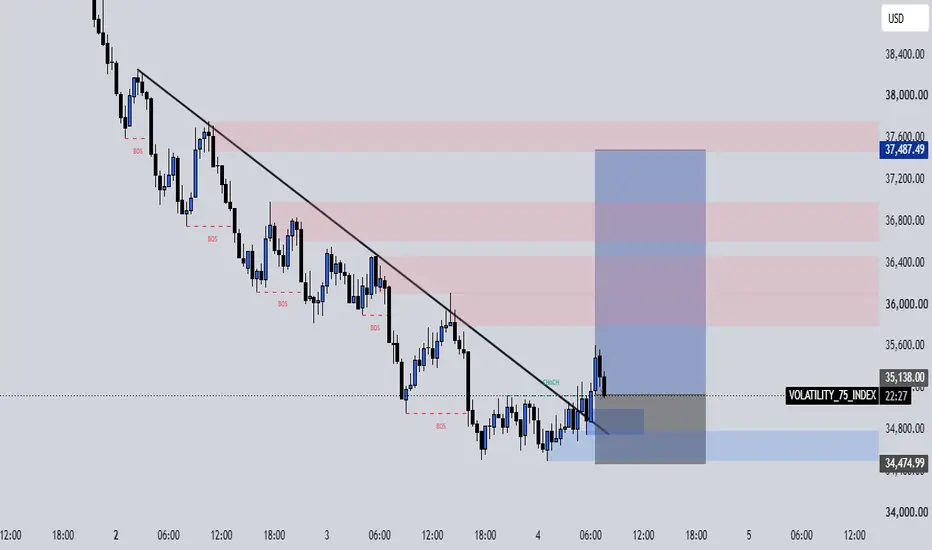
1. Market Structure: The market was previously in a downtrend, forming Lower Highs and Lower Lows.
2. BOS (Break of Structure): Red BOS labels show where price broke previous support levels, confirming bearish momentum.
3. Trendline: The black descending trendline shows the previous bearish direction. Price later broke above it.
4. Supply Zones: Red areas represent potential selling zones where price may face resistance.
5. Demand Zone: The blue area represents a potential buying zone where buyers may enter.
6. CHoCH: The green CHoCH indicates a possible change from bearish to bullish market structure.
7. BUY Setup:
Entry: 35,138.00
Take Profit: 37,487.49
Stop Loss: 34,474.99
Conclusion: Price is showing signs of a bullish reversal after reacting to the demand zone and breaking the descending trendline. A BUY opportunity is possible, but always wait for confirmation and manage your risk.
1. Market Structure: The market was previously in a downtrend, forming Lower Highs and Lower Lows.
2. BOS (Break of Structure): Red BOS labels show where price broke previous support levels, confirming bearish momentum.
3. Trendline: The black descending trendline shows the previous bearish direction. Price later broke above it.
4. Supply Zones: Red areas represent potential selling zones where price may face resistance.
5. Demand Zone: The blue area represents a potential buying zone where buyers may enter.
6. CHoCH: The green CHoCH indicates a possible change from bearish to bullish market structure.
7. BUY Setup:
Entry: 35,138.00
Take Profit: 37,487.49
Stop Loss: 34,474.99
Conclusion: Price is showing signs of a bullish reversal after reacting to the demand zone and breaking the descending trendline. A BUY opportunity is possible, but always wait for confirmation and manage your risk.

Thông báo miễn trừ trách nhiệm
Thông tin và các ấn phẩm này không nhằm mục đích, và không cấu thành, lời khuyên hoặc khuyến nghị về tài chính, đầu tư, giao dịch hay các loại khác do TradingView cung cấp hoặc xác nhận. Đọc thêm tại Điều khoản Sử dụng.
Thông báo miễn trừ trách nhiệm
Thông tin và các ấn phẩm này không nhằm mục đích, và không cấu thành, lời khuyên hoặc khuyến nghị về tài chính, đầu tư, giao dịch hay các loại khác do TradingView cung cấp hoặc xác nhận. Đọc thêm tại Điều khoản Sử dụng.