
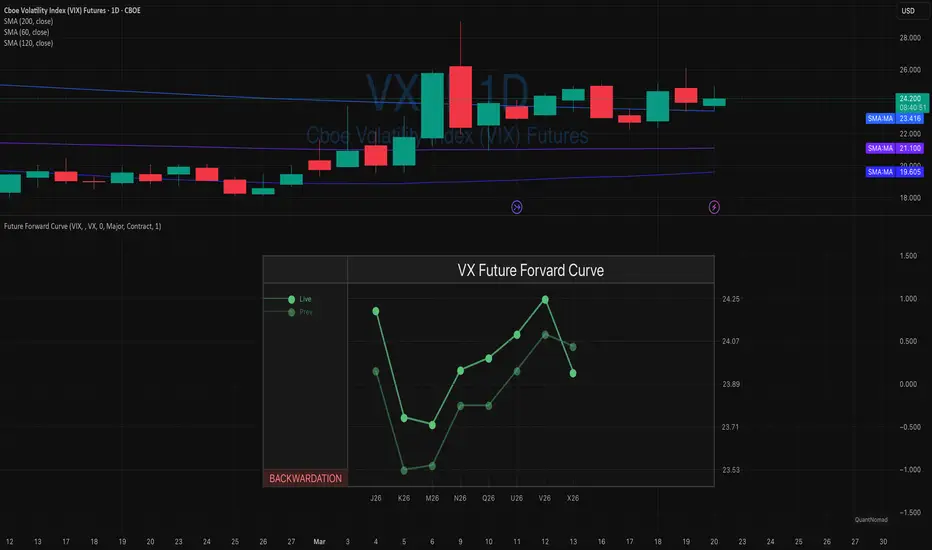
The VIX futures curve is currently extremely flat, with curve compression at ~0.55 today (vs ~0.60 yesterday) — meaning only about a $0.55 difference between the lowest and highest futures.
What makes this interesting is that it’s not easy to visually spot on a chart, but in reality, this is an unusually compressed structure for the VIX forward curve.
Such conditions are very rare, occurring in <2% of cases (~90 days since 2004).
A flat curve reflects uncertainty across maturities, where the market is pricing similar volatility regardless of time horizon.
Historically, these regimes tend not to persist and often resolve with volatility expansion.
Past examples include:
• November 2007
• October & December 2018
• March / April 2025
➡️ Not a standalone signal, but a condition to monitor
➡️ Suggests asymmetric risk toward higher volatility
Disclaimer:
This analysis is for educational purposes only and reflects personal market observations. It does not constitute investment, financial, or trading advice. Always conduct your own research before making trading decisions.

Quant Developer | Pine Script v6 | Python & R
12+ yrs in systematic trading, derivatives & hedge funds
🚀 Pro Indicators & Tools:
qntly.com/pro
💼 Quant Advisory & Development:
qntly.com/hire
12+ yrs in systematic trading, derivatives & hedge funds
🚀 Pro Indicators & Tools:
qntly.com/pro
💼 Quant Advisory & Development:
qntly.com/hire
Thông báo miễn trừ trách nhiệm
Thông tin và các ấn phẩm này không nhằm mục đích, và không cấu thành, lời khuyên hoặc khuyến nghị về tài chính, đầu tư, giao dịch hay các loại khác do TradingView cung cấp hoặc xác nhận. Đọc thêm tại Điều khoản Sử dụng.