Long
How high will waves go? Chart suggests $56.
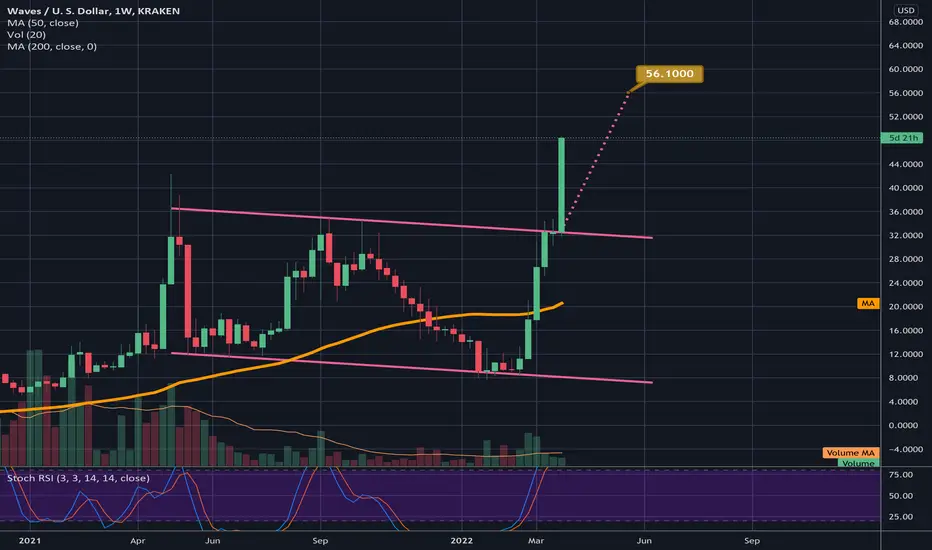
Waves having a crazy bullish pump in which it has reached a new all time high, and based on the chart pattern it broke up from of a falling channel, it should keep going until it reaches its target at $56. I’m guessing a correction from there but it could easily continue higher after cooling off. We can also see a bit of a double bottom inside the channel however the double bottom pattern has the same breakout target as the channel. *not financial advice*
Ghi chú
From its low in January of $8 that will be a 7x and almost 700% gain!Ghi chú
TARGET HIT!
Thông báo miễn trừ trách nhiệm
Thông tin và các ấn phẩm này không nhằm mục đích, và không cấu thành, lời khuyên hoặc khuyến nghị về tài chính, đầu tư, giao dịch hay các loại khác do TradingView cung cấp hoặc xác nhận. Đọc thêm tại Điều khoản Sử dụng.
Thông báo miễn trừ trách nhiệm
Thông tin và các ấn phẩm này không nhằm mục đích, và không cấu thành, lời khuyên hoặc khuyến nghị về tài chính, đầu tư, giao dịch hay các loại khác do TradingView cung cấp hoặc xác nhận. Đọc thêm tại Điều khoản Sử dụng.