
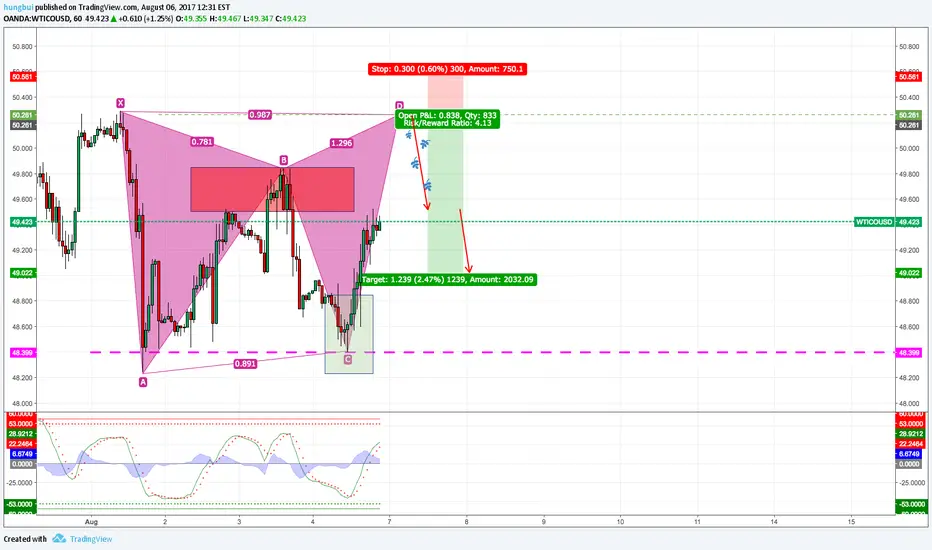
Experiment Gartley Pattern on WTI Crude Oil - 1H chart
Rules:
1. AB strictly fall between range 0.618 - 0.768 retracement of XA
2. C point terminated between range 0.618 - 1 retracement of AB leg.
3. C cannot cross A level
4. D (Very Important) - Should be between 0.618 - 1 retracement of XA leg. However, I used Fibonacci Extension and pick D at 1.272 which is very close to "1" and very safe to "Short" from this point.
Things to remember when trading
* Wait for the perfect setup. Patient Patient Patient.
* Don't use "Hard Stop". Use "Soft Stop"
* Use have to willing to lose when you trade
* Don't go too big
* Don't over trade. Find a perfect setup and stick to it.
Rules:
1. AB strictly fall between range 0.618 - 0.768 retracement of XA
2. C point terminated between range 0.618 - 1 retracement of AB leg.
3. C cannot cross A level
4. D (Very Important) - Should be between 0.618 - 1 retracement of XA leg. However, I used Fibonacci Extension and pick D at 1.272 which is very close to "1" and very safe to "Short" from this point.
- Safe to SHORT with low Stop Loss range.
- Higher Profit/Loss ratio
Things to remember when trading
* Wait for the perfect setup. Patient Patient Patient.
* Don't use "Hard Stop". Use "Soft Stop"
* Use have to willing to lose when you trade
* Don't go too big
* Don't over trade. Find a perfect setup and stick to it.
Đã hủy lệnh

Thông báo miễn trừ trách nhiệm
Thông tin và các ấn phẩm này không nhằm mục đích, và không cấu thành, lời khuyên hoặc khuyến nghị về tài chính, đầu tư, giao dịch hay các loại khác do TradingView cung cấp hoặc xác nhận. Đọc thêm tại Điều khoản Sử dụng.
Thông báo miễn trừ trách nhiệm
Thông tin và các ấn phẩm này không nhằm mục đích, và không cấu thành, lời khuyên hoặc khuyến nghị về tài chính, đầu tư, giao dịch hay các loại khác do TradingView cung cấp hoặc xác nhận. Đọc thêm tại Điều khoản Sử dụng.