
1. All macro outlook predictions realized
-We previously marked this week as a critical employment week, where ADP and Nonfarm Payrolls reports would drive gold price moves. Weak employment figures would weigh on the US Dollar and Treasury yields and sharply ease market bets on Fed rate hikes.
-After ADP printed weaker than forecasts, we expected a disappointing Nonfarm Payrolls reading. Post-release, the US Dollar Index broke below 101, short and long-dated Treasury yields slumped broadly, and the odds of a September rate hike fell from 80% to 51%. Market moves fully matched our forecast.
-We accurately defined the nature of this rally: it is not a long-term bull market, only an intermediate corrective bounce following prior declines. Weekly charts remain under bearish pressure, and profit-taking pullbacks were due after the sharp rally. The current sideways consolidation at highs fully validates this view.
-Capital flow logic was clearly outlined: soft labor data dampened rate hike bets, drawing capital into gold as a safe-haven and inflation hedge, which pushed gold prices up more than 2% in the short run, consistent with real market performance.
2. All technical pattern and key level forecasts correct
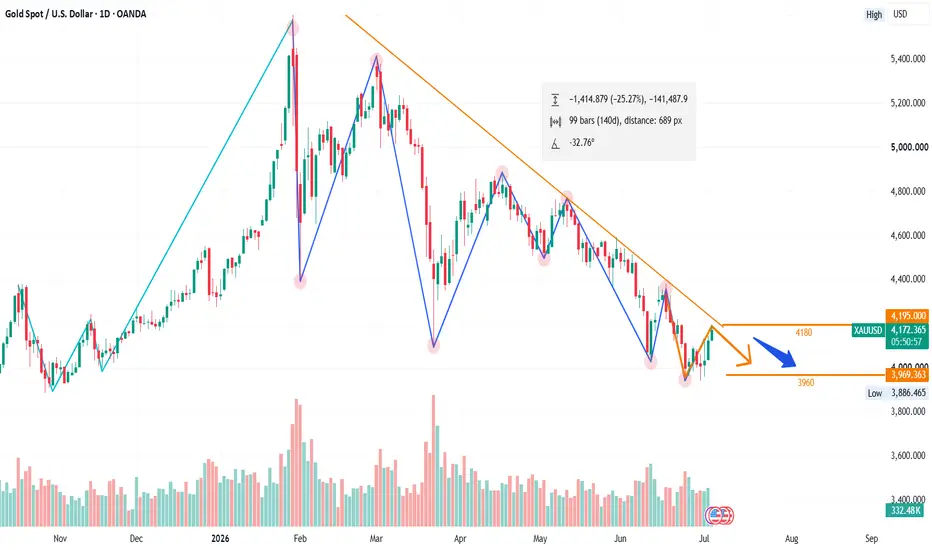
-Bottom structure forecast: The double bottom at 3960 acted as solid effective support. Gold rebounded swiftly every time it tested this zone this week, confirming the support’s reliability.
-Key dividing level forecast: 4100 serves as the bull-bear watershed. Gold staged a strong breakout and held firmly above this level, establishing a short-term bull trend as predicted.
-Resistance zone forecast: The prior peak at 4115 was immediate near-term resistance, which gold broke through smoothly. The medium-term descending trendline at 4200–4220 represents major strong resistance. Gold faced selling pressure and consolidated around 4180 after surging, matching our resistance zone assessment.
-Indicator cycle forecast: Hourly indicators entered overbought territory after the sharp rally, signaling an upcoming technical pullback. Gold traded sideways at highs with mild retracements for indicator correction in the latter half of the week, fully aligning with our analysis.
3. Long and short range trading strategies aligned with market action
-Long entry range 4100–4110 with tiered targets 4140, 4160, 4180. Gold repeatedly found support near 4100 before climbing higher, hitting all profit-taking targets.
-Short entry ranges 4175–4185 and 4180–4195 with targets 4160, 4150. Gold met resistance upon reaching these zones and pulled back, touching all short profit levels.
4. Precise forecasts of market rhythm
-Trend shift forecast: The market traded within a bearish consolidation range earlier in the week. Dual bullish catalysts from ADP and Nonfarm Payrolls triggered a shift to short-term bullish dominance, with price action reversing as expected.
-Market phase forecast: A sharp one-way rally emerged right after data releases, followed by sideways consolidation at highs instead of sustained vertical gains. Current price action fully complies with this rhythm judgment.
-We previously marked this week as a critical employment week, where ADP and Nonfarm Payrolls reports would drive gold price moves. Weak employment figures would weigh on the US Dollar and Treasury yields and sharply ease market bets on Fed rate hikes.
-After ADP printed weaker than forecasts, we expected a disappointing Nonfarm Payrolls reading. Post-release, the US Dollar Index broke below 101, short and long-dated Treasury yields slumped broadly, and the odds of a September rate hike fell from 80% to 51%. Market moves fully matched our forecast.
-We accurately defined the nature of this rally: it is not a long-term bull market, only an intermediate corrective bounce following prior declines. Weekly charts remain under bearish pressure, and profit-taking pullbacks were due after the sharp rally. The current sideways consolidation at highs fully validates this view.
-Capital flow logic was clearly outlined: soft labor data dampened rate hike bets, drawing capital into gold as a safe-haven and inflation hedge, which pushed gold prices up more than 2% in the short run, consistent with real market performance.
2. All technical pattern and key level forecasts correct
-Bottom structure forecast: The double bottom at 3960 acted as solid effective support. Gold rebounded swiftly every time it tested this zone this week, confirming the support’s reliability.
-Key dividing level forecast: 4100 serves as the bull-bear watershed. Gold staged a strong breakout and held firmly above this level, establishing a short-term bull trend as predicted.
-Resistance zone forecast: The prior peak at 4115 was immediate near-term resistance, which gold broke through smoothly. The medium-term descending trendline at 4200–4220 represents major strong resistance. Gold faced selling pressure and consolidated around 4180 after surging, matching our resistance zone assessment.
-Indicator cycle forecast: Hourly indicators entered overbought territory after the sharp rally, signaling an upcoming technical pullback. Gold traded sideways at highs with mild retracements for indicator correction in the latter half of the week, fully aligning with our analysis.
3. Long and short range trading strategies aligned with market action
-Long entry range 4100–4110 with tiered targets 4140, 4160, 4180. Gold repeatedly found support near 4100 before climbing higher, hitting all profit-taking targets.
-Short entry ranges 4175–4185 and 4180–4195 with targets 4160, 4150. Gold met resistance upon reaching these zones and pulled back, touching all short profit levels.
4. Precise forecasts of market rhythm
-Trend shift forecast: The market traded within a bearish consolidation range earlier in the week. Dual bullish catalysts from ADP and Nonfarm Payrolls triggered a shift to short-term bullish dominance, with price action reversing as expected.
-Market phase forecast: A sharp one-way rally emerged right after data releases, followed by sideways consolidation at highs instead of sustained vertical gains. Current price action fully complies with this rhythm judgment.
Giao dịch đang hoạt động
We accurately defined the nature of this rally: it is not a long-term bull market, only an intermediate corrective bounce following prior declines. Weekly charts remain under bearish pressure, and profit-taking pullbacks were due after the sharp rally. The current sideways consolidation at highs fully validates this view.
Thông báo miễn trừ trách nhiệm
Thông tin và các ấn phẩm này không nhằm mục đích, và không cấu thành, lời khuyên hoặc khuyến nghị về tài chính, đầu tư, giao dịch hay các loại khác do TradingView cung cấp hoặc xác nhận. Đọc thêm tại Điều khoản Sử dụng.
Thông báo miễn trừ trách nhiệm
Thông tin và các ấn phẩm này không nhằm mục đích, và không cấu thành, lời khuyên hoặc khuyến nghị về tài chính, đầu tư, giao dịch hay các loại khác do TradingView cung cấp hoặc xác nhận. Đọc thêm tại Điều khoản Sử dụng.