
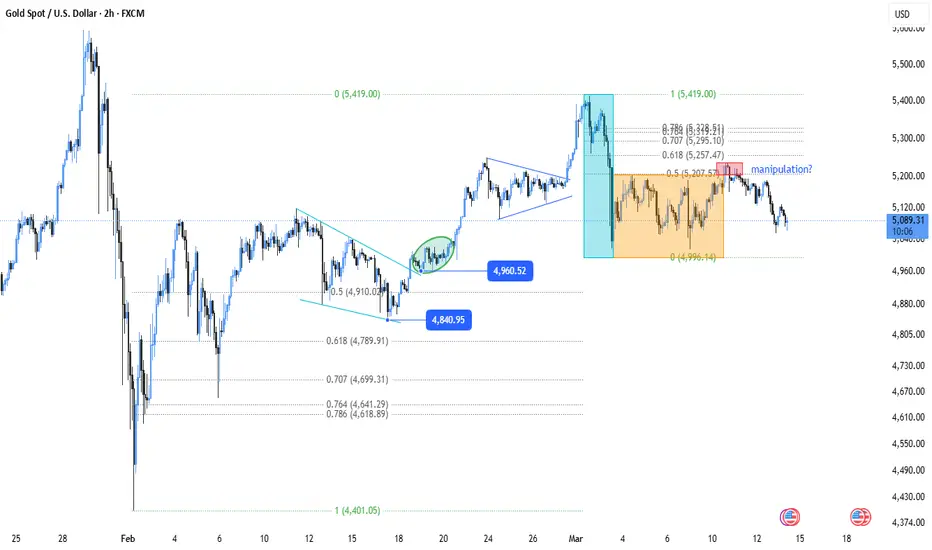
XAUUSD — Accumulation → Manipulation → Distribution Inside Range
XAUUSD is currently trading inside a post-impulse corrective structure that can be interpreted through an Accumulation → Manipulation → Distribution framework.
After the sharp bearish displacement from the 5,400 region, price did not transition into an immediate bullish continuation. Instead, the market stabilized and began rotating horizontally inside a well-defined range.
That behavior matters because this type of structure often reflects inventory rebalancing after a major move. In this case, the range appears to be forming under a significant resistance layer, which means the market may be redistributing positions rather than building a base for a fresh impulsive rally.
In other words, the current structure represents a decision zone where liquidity is being built on both sides of the range before the next directional expansion.
Structure Read
The market printed a strong bearish displacement from the 5,400 area and found temporary equilibrium around the 4,990–5,015 region. This zone acted as the structural base where the initial selling pressure was absorbed.
From that point, price rotated upward toward the upper half of the range but repeatedly failed to establish acceptance above the resistance band.
This behavior allows the current structure to be interpreted in three phases:
The key structural point is that this entire formation is occurring after a bearish displacement. Until the market proves otherwise, that keeps the structure biased toward bearish continuation rather than immediate bullish reversal.
Technical Map
The current range sits directly below a layered resistance structure, which continues to cap upside expansion unless price can reclaim those zones with acceptance.
Even if price pushes higher inside the range, it is still moving into overhead supply rather than into a clean breakout environment.
On the downside, support and liquidity pockets remain clearly defined.
If the lower boundary fails, price would likely transition into a deeper liquidity sweep toward these zones.
Order-Flow Logic
This structure reflects typical post-displacement behavior.
First, the market delivered a strong markdown leg.
Second, price transitioned into horizontal rotation instead of immediate bullish continuation.
Third, repeated tests of the upper boundary have failed to convert into structural acceptance.
This sequence suggests the market is still processing the prior selloff rather than reclaiming value.
Buyers have managed to slow the downside momentum, but they have not yet proven control of the market structure.
As long as price remains capped below the upper resistance band, the burden of proof remains on buyers.
Macro Overlay
From a macro perspective, gold is currently trading in a mixed environment.
Narratively, gold continues to benefit from geopolitical uncertainty and defensive positioning. However, structurally the market has not yet repaired the damage created by the selloff from the 5,400 region.
This divergence is important.
The macro narrative may support gold over the longer term, but the current price structure still behaves like a correction under resistance rather than a confirmed bullish expansion.
Narrative vs Structure
Narratively, gold retains support from safe-haven demand and macro uncertainty.
Structurally, however, the market remains capped below the 5,220–5,250 resistance zone.
That means the narrative may appear supportive, but the chart has not yet confirmed that strength.
Until price reclaims that resistance band with acceptance, the current move continues to look more like redistribution than a renewed bullish trend.
Decision Zone
The current range represents the primary decision zone for the next directional move.
Until one side loses control, price is likely to continue rotating within the range as liquidity builds.
Primary Scenario — Bearish Continuation
This remains the higher-probability scenario while price remains below resistance.
Conditions:
Confirmation:
Targets:
Alternative Scenario — Upside Break
This scenario requires structural confirmation rather than a simple wick above resistance.
Conditions:
Confirmation:
Even in this case, the move would first indicate pattern evolution rather than immediate trend reversal.
Bias
Invalidation
The bearish Accumulation → Manipulation → Distribution thesis becomes invalid if price breaks and sustains acceptance above the 5,220 – 5,250 resistance zone.
If that occurs, the market is likely transitioning out of distribution and into a broader recovery structure, which would require a recalibration of the downside map.
Conclusion
XAUUSD is currently trading inside a structured corrective range following a major bearish displacement.
The lower boundary reflects absorption.
The push toward the highs reflects a liquidity probe.
The repeated failure under resistance suggests distribution may now be underway.
As long as price remains capped below 5,220 – 5,250, the market remains vulnerable to a downside expansion toward 4,841 – 4,883, with deeper corrective potential toward 4,790 – 4,813 and possibly 4,646 – 4,679 if the range floor breaks.
XAUUSD is currently trading inside a post-impulse corrective structure that can be interpreted through an Accumulation → Manipulation → Distribution framework.
After the sharp bearish displacement from the 5,400 region, price did not transition into an immediate bullish continuation. Instead, the market stabilized and began rotating horizontally inside a well-defined range.
That behavior matters because this type of structure often reflects inventory rebalancing after a major move. In this case, the range appears to be forming under a significant resistance layer, which means the market may be redistributing positions rather than building a base for a fresh impulsive rally.
In other words, the current structure represents a decision zone where liquidity is being built on both sides of the range before the next directional expansion.
Structure Read
The market printed a strong bearish displacement from the 5,400 area and found temporary equilibrium around the 4,990–5,015 region. This zone acted as the structural base where the initial selling pressure was absorbed.
From that point, price rotated upward toward the upper half of the range but repeatedly failed to establish acceptance above the resistance band.
This behavior allows the current structure to be interpreted in three phases:
- Accumulation near the lower boundary after the initial selloff where selling pressure was absorbed.
- Manipulation as price pushed toward the upper boundary and probed buy-side liquidity.
- Distribution as the market failed to hold the highs and rotated back into the range under resistance.
The key structural point is that this entire formation is occurring after a bearish displacement. Until the market proves otherwise, that keeps the structure biased toward bearish continuation rather than immediate bullish reversal.
Technical Map
The current range sits directly below a layered resistance structure, which continues to cap upside expansion unless price can reclaim those zones with acceptance.
- Main resistance / invalidation zone: 5,220 – 5,250
- Secondary sell zone: 5,286.3 – 5,306.5
- Higher resistance cluster: 5,512.8 – 5,541.5
Even if price pushes higher inside the range, it is still moving into overhead supply rather than into a clean breakout environment.
On the downside, support and liquidity pockets remain clearly defined.
- Primary support base: 4,990.5 – 5,017.4
- First bearish objective: 4,841.3 – 4,883.6
- Secondary demand zone: 4,790.6 – 4,813.0
- Deeper macro demand: 4,646.8 – 4,679.7
If the lower boundary fails, price would likely transition into a deeper liquidity sweep toward these zones.
Order-Flow Logic
This structure reflects typical post-displacement behavior.
First, the market delivered a strong markdown leg.
Second, price transitioned into horizontal rotation instead of immediate bullish continuation.
Third, repeated tests of the upper boundary have failed to convert into structural acceptance.
This sequence suggests the market is still processing the prior selloff rather than reclaiming value.
Buyers have managed to slow the downside momentum, but they have not yet proven control of the market structure.
As long as price remains capped below the upper resistance band, the burden of proof remains on buyers.
Macro Overlay
From a macro perspective, gold is currently trading in a mixed environment.
Narratively, gold continues to benefit from geopolitical uncertainty and defensive positioning. However, structurally the market has not yet repaired the damage created by the selloff from the 5,400 region.
This divergence is important.
The macro narrative may support gold over the longer term, but the current price structure still behaves like a correction under resistance rather than a confirmed bullish expansion.
Narrative vs Structure
Narratively, gold retains support from safe-haven demand and macro uncertainty.
Structurally, however, the market remains capped below the 5,220–5,250 resistance zone.
That means the narrative may appear supportive, but the chart has not yet confirmed that strength.
Until price reclaims that resistance band with acceptance, the current move continues to look more like redistribution than a renewed bullish trend.
Decision Zone
The current range represents the primary decision zone for the next directional move.
- A downside break would confirm that the range was only a pause after bearish displacement.
- An upside break would force a structural reassessment, but only if price can hold above the resistance band.
Until one side loses control, price is likely to continue rotating within the range as liquidity builds.
Primary Scenario — Bearish Continuation
This remains the higher-probability scenario while price remains below resistance.
Conditions:
- Failure to sustain above the upper half of the range.
- Continued rejection below 5,220 – 5,250.
- Break below the support base around 4,990 – 5,015.
Confirmation:
- 2H or 4H acceptance below the range floor.
- Weak reclaim attempt after the breakdown.
- Expansion candles targeting lower liquidity.
Targets:
- First objective: 4,841.3 – 4,883.6
- Second objective: 4,790.6 – 4,813.0
- Third objective: 4,646.8 – 4,679.7
Alternative Scenario — Upside Break
This scenario requires structural confirmation rather than a simple wick above resistance.
Conditions:
- Break above the 5,220 – 5,250 resistance zone.
- Acceptance above the range ceiling.
- Continuation into the 5,286 – 5,306 supply region.
Confirmation:
- Strong displacement candle through resistance.
- Successful retest of the broken resistance zone as support.
- Follow-through toward the next resistance layer.
Even in this case, the move would first indicate pattern evolution rather than immediate trend reversal.
Bias
- Short-term bias: Neutral inside the range but bearish while below 5,220 – 5,250.
- Medium-term bias: Corrective bearish because the current structure remains beneath the post-dump resistance layers.
Invalidation
The bearish Accumulation → Manipulation → Distribution thesis becomes invalid if price breaks and sustains acceptance above the 5,220 – 5,250 resistance zone.
If that occurs, the market is likely transitioning out of distribution and into a broader recovery structure, which would require a recalibration of the downside map.
Conclusion
XAUUSD is currently trading inside a structured corrective range following a major bearish displacement.
The lower boundary reflects absorption.
The push toward the highs reflects a liquidity probe.
The repeated failure under resistance suggests distribution may now be underway.
As long as price remains capped below 5,220 – 5,250, the market remains vulnerable to a downside expansion toward 4,841 – 4,883, with deeper corrective potential toward 4,790 – 4,813 and possibly 4,646 – 4,679 if the range floor breaks.
Đóng lệnh: đạt mục tiêu
XAUUSD — Update: Distribution Completed, Markdown DeliveredThis is a follow-up to the previous idea based on the rectangle / Accumulation → Manipulation → Distribution framework.
Since the initial publication, price has confirmed the bearish scenario and delivered the expected downside expansion. The key takeaway is that the range did not act as re-accumulation — it resolved as distribution under resistance, followed by a clean markdown phase.
What Changed
The market failed to reclaim the upper boundary and instead showed repeated rejection below the 5,220 – 5,250 resistance zone. That behavior confirmed that the prior push into the highs was not strength, but rather a liquidity sweep (manipulation).
Once price lost the range floor around 4,990 – 5,015, the structure transitioned from balance into imbalance, triggering downside continuation.
This confirms the initial read:
the range was not a base — it was a redistribution phase before continuation lower.
Structure Outcome
- Manipulation phase: sweep into upper range / resistance.
- Failure to achieve acceptance above supply.
- Break of range low (4,990 – 5,015).
- Expansion into lower liquidity zones.
Price has now reached and reacted from the first downside objectives, validating the distribution thesis.
Targets Status
- 4,841.3 – 4,883.6: Reached and reacted.
- 4,790 – 4,813: Tapped / partially filled.
This confirms that the move was not random volatility, but a structured continuation following the range breakdown.
Order-Flow Confirmation
The breakdown was characterized by:
- Clear displacement below the range floor.
- No meaningful bullish reclaim of the broken support.
- Continuation candles targeting liquidity below.
This is consistent with markdown after distribution, where once the market leaves the range, it moves efficiently toward the next liquidity pools.
Macro Confirmation
Fundamentals aligned with the move.
Recent developments show:
- Oil surged above $100, increasing inflation expectations.
- Federal Reserve held rates steady and signaled limited rate cuts.
- U.S. yields moved higher and the dollar strengthened.
These factors increased the opportunity cost of holding gold and reduced the effectiveness of its safe-haven bid, which contributed to the downside move. :contentReference[oaicite:0]{index=0}
Additionally, markets shifted into a liquidity preference regime, where capital favored USD over gold despite geopolitical risk. :contentReference[oaicite:1]{index=1}
Key Insight
This move reinforces an important structural principle:
Not all consolidations are accumulation.
When a range forms after bearish displacement and below resistance, the probability of distribution is significantly higher unless buyers can reclaim key levels with acceptance.
In this case, the failure to reclaim 5,220 – 5,250 was the defining signal.
What Now
Price is now trading in a lower liquidity zone after completing the initial markdown leg.
At this stage, the market is likely transitioning into one of two states:
- Continuation: further downside expansion toward deeper macro demand.
- Rebalancing: short-term consolidation after an impulsive move.
The key difference now is that the market is no longer in a neutral range — it has already committed directionally.
Conclusion
The previous idea has played out as expected.
The rectangle structure resolved as Accumulation → Manipulation → Distribution, followed by a confirmed breakdown and downside expansion.
Targets have been delivered, and the market has transitioned from balance into a markdown phase.
This update confirms that the prior range was not a base for continuation higher, but a redistribution structure under resistance that led into the current bearish leg.

For live market updates and high-probability setups, join my Telegram: t.me/G_Traders
Bài đăng liên quan
Thông báo miễn trừ trách nhiệm
Thông tin và các ấn phẩm này không nhằm mục đích, và không cấu thành, lời khuyên hoặc khuyến nghị về tài chính, đầu tư, giao dịch hay các loại khác do TradingView cung cấp hoặc xác nhận. Đọc thêm tại Điều khoản Sử dụng.
For live market updates and high-probability setups, join my Telegram: t.me/G_Traders
Bài đăng liên quan
Thông báo miễn trừ trách nhiệm
Thông tin và các ấn phẩm này không nhằm mục đích, và không cấu thành, lời khuyên hoặc khuyến nghị về tài chính, đầu tư, giao dịch hay các loại khác do TradingView cung cấp hoặc xác nhận. Đọc thêm tại Điều khoản Sử dụng.