
About today's market environment:
Major markets including China, Japan, and the UK are closed today, leading to reduced liquidity. In this environment, bearish momentum can more easily dominate, and any bounce is likely to lack sustainability — meaning even if prices rise, the rebound probably won't last long.
Key geopolitical news to watch:
Trump has announced the launch of a Strait of Hormuz operation, and Iran is reviewing the US response.
If tensions escalate suddenly: Safe-haven demand could quickly push gold higher
If a peaceful breakthrough occurs: Gold may face further downside pressure
Geopolitical news can move markets fast, but its impact is often short-lived. Be extra cautious with risk management in such conditions.
Multi-timeframe technical breakdown:
Daily Chart (1D): Resistance is dense above. For a true reversal to form, bulls need very strong momentum to break through decisively. In short — not just any bounce will reverse the current structure.
4-Hour Chart (4H):
MACD: The green histogram bars have shown signs of expanding again after a period of contraction, and the lines are hinting at a potential golden cross. However — without volume or momentum confirmation, this could be a false signal.
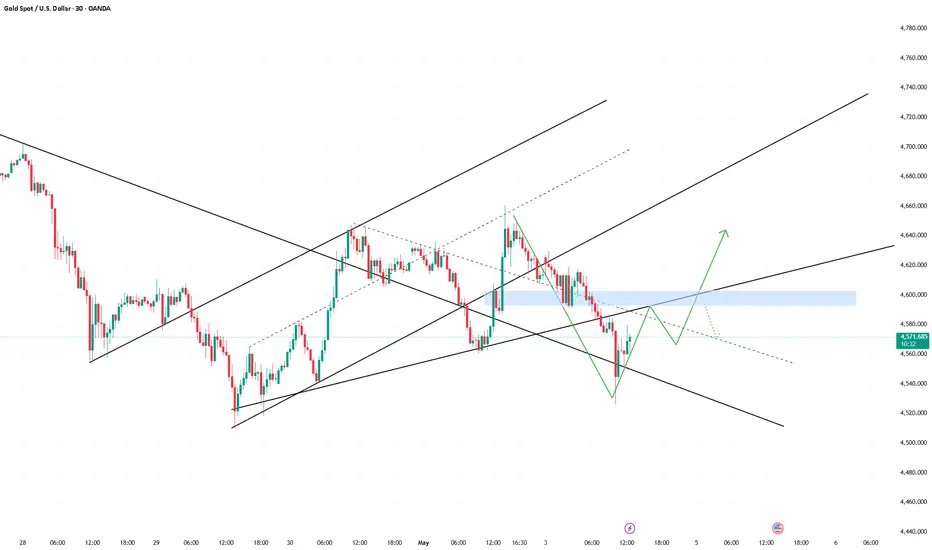
Bollinger Bands: Price is currently testing middle-band resistance. Watch this level closely. If price can hold steadily above 4588, and with volume confirmation, gold could be pushed back up toward 4660.
2H / 1H Charts: Showing signs of bottoming, but it still depends on whether strong bullish money steps in. Without strong buying pressure, the market will likely remain in weak consolidation in the near term.
Key Levels Summary:
Resistance :
First resistance zone: 4588 - 4605
Second resistance zone: 4625 - 4635 / 4656-4670
Support :
First support zone: 4555 - 4542
Second support zone: 4522 - 4510
Core support: 4500 (round number) — this is a critical level
Special note:
If 4500 is clearly broken (not a false break, but a confirmed breakdown), downside room will open up. Prices could gradually fall toward the 23.6% Fibonacci retracement level around 4450.
Trading approach:
Operate around the key levels above using a buy-low, sell-high (range trading) strategy — look to buy near support zones and sell near resistance zones. Avoid chasing breakouts or panic selling.
Major markets including China, Japan, and the UK are closed today, leading to reduced liquidity. In this environment, bearish momentum can more easily dominate, and any bounce is likely to lack sustainability — meaning even if prices rise, the rebound probably won't last long.
Key geopolitical news to watch:
Trump has announced the launch of a Strait of Hormuz operation, and Iran is reviewing the US response.
If tensions escalate suddenly: Safe-haven demand could quickly push gold higher
If a peaceful breakthrough occurs: Gold may face further downside pressure
Geopolitical news can move markets fast, but its impact is often short-lived. Be extra cautious with risk management in such conditions.
Multi-timeframe technical breakdown:
Daily Chart (1D): Resistance is dense above. For a true reversal to form, bulls need very strong momentum to break through decisively. In short — not just any bounce will reverse the current structure.
4-Hour Chart (4H):
MACD: The green histogram bars have shown signs of expanding again after a period of contraction, and the lines are hinting at a potential golden cross. However — without volume or momentum confirmation, this could be a false signal.
Bollinger Bands: Price is currently testing middle-band resistance. Watch this level closely. If price can hold steadily above 4588, and with volume confirmation, gold could be pushed back up toward 4660.
2H / 1H Charts: Showing signs of bottoming, but it still depends on whether strong bullish money steps in. Without strong buying pressure, the market will likely remain in weak consolidation in the near term.
Key Levels Summary:
Resistance :
First resistance zone: 4588 - 4605
Second resistance zone: 4625 - 4635 / 4656-4670
Support :
First support zone: 4555 - 4542
Second support zone: 4522 - 4510
Core support: 4500 (round number) — this is a critical level
Special note:
If 4500 is clearly broken (not a false break, but a confirmed breakdown), downside room will open up. Prices could gradually fall toward the 23.6% Fibonacci retracement level around 4450.
Trading approach:
Operate around the key levels above using a buy-low, sell-high (range trading) strategy — look to buy near support zones and sell near resistance zones. Avoid chasing breakouts or panic selling.

Bài đăng liên quan
Thông báo miễn trừ trách nhiệm
Thông tin và các ấn phẩm này không nhằm mục đích, và không cấu thành, lời khuyên hoặc khuyến nghị về tài chính, đầu tư, giao dịch hay các loại khác do TradingView cung cấp hoặc xác nhận. Đọc thêm tại Điều khoản Sử dụng.
Bài đăng liên quan
Thông báo miễn trừ trách nhiệm
Thông tin và các ấn phẩm này không nhằm mục đích, và không cấu thành, lời khuyên hoặc khuyến nghị về tài chính, đầu tư, giao dịch hay các loại khác do TradingView cung cấp hoặc xác nhận. Đọc thêm tại Điều khoản Sử dụng.