
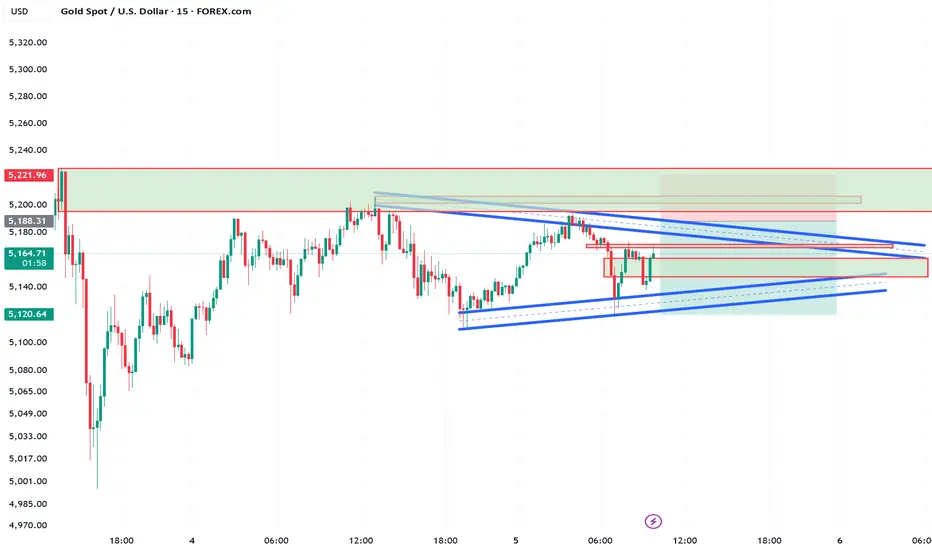
On the M15 timeframe, price is currently trading inside a compression structure formed by a descending resistance trendline and an ascending support trendline. This creates a triangle pattern, which often leads to a strong breakout.
The current bias remains bearish, because the market continues to form lower highs while struggling to break above the resistance area.
The key resistance zone is located around 5180–5190, where multiple factors align:
Previous market structure resistance
A visible supply zone
The upper boundary of the descending trendline
A fair value gap (FVG) area that price may revisit before continuing lower
Because of this confluence, the plan is to look for a short entry near the resistance area.
Trade Plan
Entry:
Sell around 5188
This level sits inside the resistance cluster where sellers previously stepped in.
Stop Loss:
5222
The stop loss is placed above the resistance zone and above the previous swing high. If price reaches this level, the bearish structure would likely be invalidated.
Take Profit Targets:
TP1 – 5120
First major support and liquidity zone.
TP2 – 5095
Breakout level where many sell stops may trigger.
TP3 – 5050
Next major liquidity area and downside target.
Trade Idea
The idea behind this setup is that price may retest the resistance area within the triangle, take liquidity from late buyers, and then continue moving downward toward the lower liquidity zones.
If the triangle breaks to the downside, the move could accelerate as sell-side liquidity is activated below support.
The current bias remains bearish, because the market continues to form lower highs while struggling to break above the resistance area.
The key resistance zone is located around 5180–5190, where multiple factors align:
Previous market structure resistance
A visible supply zone
The upper boundary of the descending trendline
A fair value gap (FVG) area that price may revisit before continuing lower
Because of this confluence, the plan is to look for a short entry near the resistance area.
Trade Plan
Entry:
Sell around 5188
This level sits inside the resistance cluster where sellers previously stepped in.
Stop Loss:
5222
The stop loss is placed above the resistance zone and above the previous swing high. If price reaches this level, the bearish structure would likely be invalidated.
Take Profit Targets:
TP1 – 5120
First major support and liquidity zone.
TP2 – 5095
Breakout level where many sell stops may trigger.
TP3 – 5050
Next major liquidity area and downside target.
Trade Idea
The idea behind this setup is that price may retest the resistance area within the triangle, take liquidity from late buyers, and then continue moving downward toward the lower liquidity zones.
If the triangle breaks to the downside, the move could accelerate as sell-side liquidity is activated below support.

Thông báo miễn trừ trách nhiệm
Thông tin và các ấn phẩm này không nhằm mục đích, và không cấu thành, lời khuyên hoặc khuyến nghị về tài chính, đầu tư, giao dịch hay các loại khác do TradingView cung cấp hoặc xác nhận. Đọc thêm tại Điều khoản Sử dụng.
Thông báo miễn trừ trách nhiệm
Thông tin và các ấn phẩm này không nhằm mục đích, và không cấu thành, lời khuyên hoặc khuyến nghị về tài chính, đầu tư, giao dịch hay các loại khác do TradingView cung cấp hoặc xác nhận. Đọc thêm tại Điều khoản Sử dụng.