
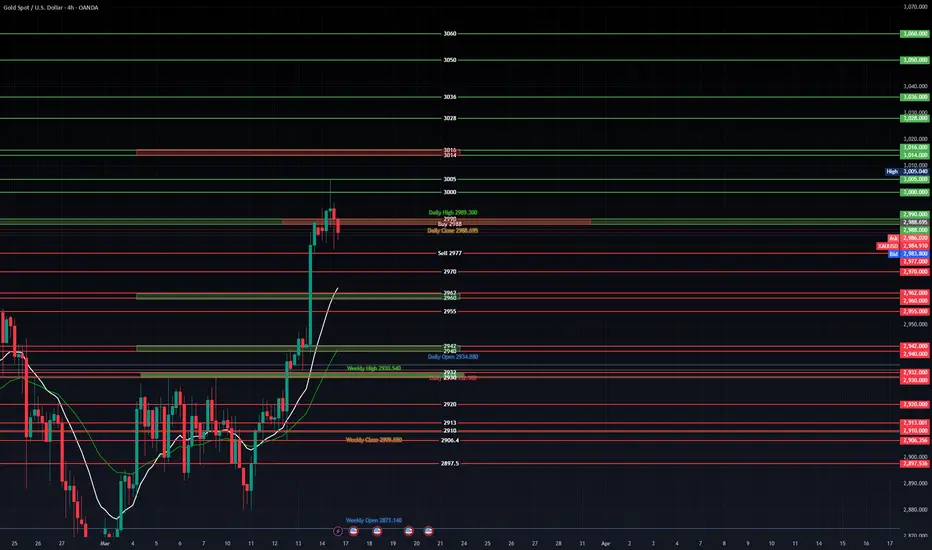
Gold has achieved new all-time highs this week, breaking the 3000 level before retreating to 2982. As we look ahead to the coming week, I've outlined key buy and sell levels on this 4-hour Gold chart, along with potential entries.
For a buy, consider entering at 2988, targeting 2990 as the first resistance. If this level is surpassed, the next resistance range could be around 3000 to 3005. It's important to follow the chart levels closely and secure profits along the way.
For a sell, an entry at 2977 could aim for a move down to 2970, with subsequent targets around 2962 to 2960 as resistance levels. Stick to the marked entries on the chart for better clarity and control.
As always use proper risk management , take profit along the way and dont overleverage
For a buy, consider entering at 2988, targeting 2990 as the first resistance. If this level is surpassed, the next resistance range could be around 3000 to 3005. It's important to follow the chart levels closely and secure profits along the way.
For a sell, an entry at 2977 could aim for a move down to 2970, with subsequent targets around 2962 to 2960 as resistance levels. Stick to the marked entries on the chart for better clarity and control.
As always use proper risk management , take profit along the way and dont overleverage

Thông báo miễn trừ trách nhiệm
Thông tin và các ấn phẩm này không nhằm mục đích, và không cấu thành, lời khuyên hoặc khuyến nghị về tài chính, đầu tư, giao dịch hay các loại khác do TradingView cung cấp hoặc xác nhận. Đọc thêm tại Điều khoản Sử dụng.
Thông báo miễn trừ trách nhiệm
Thông tin và các ấn phẩm này không nhằm mục đích, và không cấu thành, lời khuyên hoặc khuyến nghị về tài chính, đầu tư, giao dịch hay các loại khác do TradingView cung cấp hoặc xác nhận. Đọc thêm tại Điều khoản Sử dụng.