
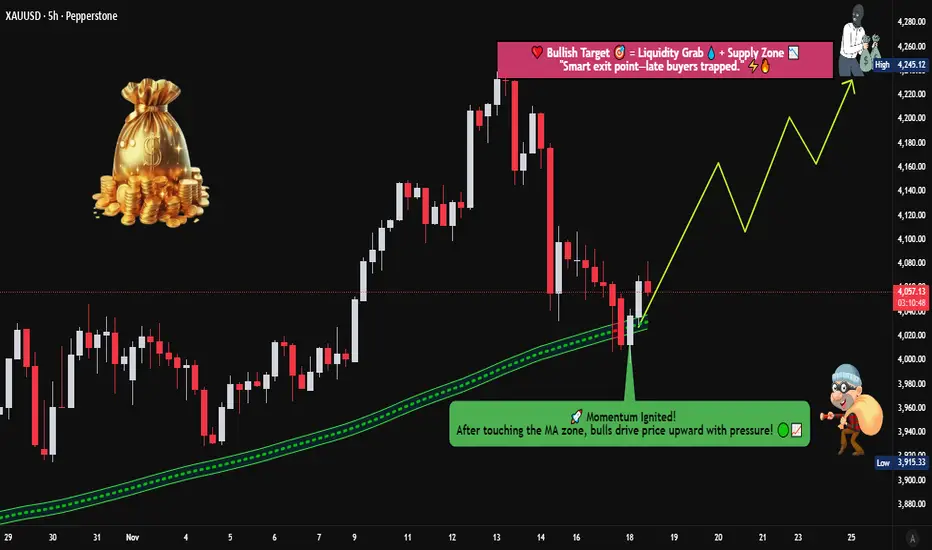
🏆 XAU/USD GOLD SWING TRADE OPPORTUNITY 💰
Bullish Pullback Setup | LSMA Moving Average Confirmation
📊 TRADE PLAN OVERVIEW
Asset: XAU/USD (Gold vs US Dollar) | METALS Market
Timeframe: Swing Trade (4H-Daily Bias)
Setup Type: Bullish Continuation on Pullback
Confirmation Indicator: LSMA Moving Average
🎯 ENTRY STRATEGY
Method: Layer Entry Using Multiple Buy Limit Orders (Recommended)
Entry Zones:
Primary Entry: 4010.00 - 4020.00 (First layer - 40% position)
Secondary Entry: 3990.00 - 4000.00 (Second layer - 35% position)
Confirmation: Wait for LSMA to show bullish crossover + price rejection from support level
🛑 RISK MANAGEMENT
Stop Loss: 3960.00
⚠️ Important Note: Adjust your SL based on YOUR personal risk tolerance & trading strategy. This is a suggested level only - YOUR risk management is YOUR responsibility.
Risk/Reward Ratio: 1:2.5 minimum recommended
🚀 PROFIT TARGET
Primary Target: 4260.00
Technical Reasons:
Strong resistance level identified
Overbought zone trap setup (scalp-friendly)
Correction potential after breakdown confirmation
Historical support/resistance confluence
⚠️ Disclaimer: Take partial profits at technical levels. TP is suggestive only - YOUR profit management is YOUR decision. Risk management is individual responsibility.
📈 TECHNICAL INDICATORS ANALYZED
✅ LSMA Moving Average - Bullish Structure Confirmation
✅ Price Action - Pullback to Support
✅ Resistance/Support Levels - Multi-timeframe confluence
✅ Overbought/Oversold Zones - Trap identification
🔗 CORRELATED PAIRS TO WATCH
1. EURUSD (EUR/USD) - Inverse Correlation ⚠️
Gold typically strengthens when USD weakens
If EURUSD rallies, XAU/USD may follow (USD weakness)
Key Point: Monitor US Dollar strength/weakness for directional bias
Setup Link: EUR strength = Gold strength
2. DXY (US Dollar Index) - Direct Inverse Correlation 📉
Most Important Correlation
When DXY falls → Gold typically rises
When DXY rises → Gold typically falls
Key Levels to Watch: DXY 105.50 - 106.50 (Major support/resistance)
Our Edge: If DXY breaks below support, XAU/USD bullish case strengthens
3. USDJPY (USD/JPY) - Strong USD Indicator 💹
High positive correlation with USD strength
If USDJPY rises sharply = USD strengthening = Gold pressure
Key Point: Monitor for conflicting signals before entry
Watch Zone: 150.00 - 151.50 resistance
4. SPX500 (S&P 500) - Risk Sentiment Indicator 📊
Risk-off environment = Gold strength
During market corrections, gold rallies (safe-haven)
Key Point: If SPX breaks major support, expect gold rally acceleration
Current Context: Monitor for equity weakness signals
5. UST10Y (US 10-Year Treasury Yield) - Rate Pressure 📉
Inverse relationship with Gold prices
Rising yields = Gold headwinds
Falling yields = Gold tailwinds
Our Setup: Lower yields support bullish gold bias
💡 PRE-TRADE CHECKLIST
Confirm LSMA bullish alignment on primary timeframe
Check DXY weakness (< 106.00 = favorable)
Verify no major economic data releases (next 4 hours)
Set layer entry limit orders (avoid FOMO market entries)
Confirm risk/reward = minimum 1:2.5
Position size = 1-2% account risk maximum
Set alerts at entry/SL/TP levels
⚡ TRADING RULES
ONLY enter on confirmed LSMA bullish structure
Use limit orders (never market buy at resistance)
Trail stop-loss once +50 pips profit locked
Take 50% profit at +100 pips minimum
Move remaining SL to breakeven + 5 pips after TP1 hit
Never add to losing position
Created For: Active Swing Traders | Technical Analysis Enthusiasts
Best Used: Combined with your own analysis & risk management
Updated: Real-time market conditions check recommended before entry
"The best trade is the one you DON'T take because it doesn't fit your plan."
Bullish Pullback Setup | LSMA Moving Average Confirmation
📊 TRADE PLAN OVERVIEW
Asset: XAU/USD (Gold vs US Dollar) | METALS Market
Timeframe: Swing Trade (4H-Daily Bias)
Setup Type: Bullish Continuation on Pullback
Confirmation Indicator: LSMA Moving Average
🎯 ENTRY STRATEGY
Method: Layer Entry Using Multiple Buy Limit Orders (Recommended)
Entry Zones:
Primary Entry: 4010.00 - 4020.00 (First layer - 40% position)
Secondary Entry: 3990.00 - 4000.00 (Second layer - 35% position)
Confirmation: Wait for LSMA to show bullish crossover + price rejection from support level
🛑 RISK MANAGEMENT
Stop Loss: 3960.00
⚠️ Important Note: Adjust your SL based on YOUR personal risk tolerance & trading strategy. This is a suggested level only - YOUR risk management is YOUR responsibility.
Risk/Reward Ratio: 1:2.5 minimum recommended
🚀 PROFIT TARGET
Primary Target: 4260.00
Technical Reasons:
Strong resistance level identified
Overbought zone trap setup (scalp-friendly)
Correction potential after breakdown confirmation
Historical support/resistance confluence
⚠️ Disclaimer: Take partial profits at technical levels. TP is suggestive only - YOUR profit management is YOUR decision. Risk management is individual responsibility.
📈 TECHNICAL INDICATORS ANALYZED
✅ LSMA Moving Average - Bullish Structure Confirmation
✅ Price Action - Pullback to Support
✅ Resistance/Support Levels - Multi-timeframe confluence
✅ Overbought/Oversold Zones - Trap identification
🔗 CORRELATED PAIRS TO WATCH
1. EURUSD (EUR/USD) - Inverse Correlation ⚠️
Gold typically strengthens when USD weakens
If EURUSD rallies, XAU/USD may follow (USD weakness)
Key Point: Monitor US Dollar strength/weakness for directional bias
Setup Link: EUR strength = Gold strength
2. DXY (US Dollar Index) - Direct Inverse Correlation 📉
Most Important Correlation
When DXY falls → Gold typically rises
When DXY rises → Gold typically falls
Key Levels to Watch: DXY 105.50 - 106.50 (Major support/resistance)
Our Edge: If DXY breaks below support, XAU/USD bullish case strengthens
3. USDJPY (USD/JPY) - Strong USD Indicator 💹
High positive correlation with USD strength
If USDJPY rises sharply = USD strengthening = Gold pressure
Key Point: Monitor for conflicting signals before entry
Watch Zone: 150.00 - 151.50 resistance
4. SPX500 (S&P 500) - Risk Sentiment Indicator 📊
Risk-off environment = Gold strength
During market corrections, gold rallies (safe-haven)
Key Point: If SPX breaks major support, expect gold rally acceleration
Current Context: Monitor for equity weakness signals
5. UST10Y (US 10-Year Treasury Yield) - Rate Pressure 📉
Inverse relationship with Gold prices
Rising yields = Gold headwinds
Falling yields = Gold tailwinds
Our Setup: Lower yields support bullish gold bias
💡 PRE-TRADE CHECKLIST
Confirm LSMA bullish alignment on primary timeframe
Check DXY weakness (< 106.00 = favorable)
Verify no major economic data releases (next 4 hours)
Set layer entry limit orders (avoid FOMO market entries)
Confirm risk/reward = minimum 1:2.5
Position size = 1-2% account risk maximum
Set alerts at entry/SL/TP levels
⚡ TRADING RULES
ONLY enter on confirmed LSMA bullish structure
Use limit orders (never market buy at resistance)
Trail stop-loss once +50 pips profit locked
Take 50% profit at +100 pips minimum
Move remaining SL to breakeven + 5 pips after TP1 hit
Never add to losing position
Created For: Active Swing Traders | Technical Analysis Enthusiasts
Best Used: Combined with your own analysis & risk management
Updated: Real-time market conditions check recommended before entry
"The best trade is the one you DON'T take because it doesn't fit your plan."
Giao dịch đang hoạt động
Đóng lệnh: đạt mục tiêu

Bài đăng liên quan
Thông báo miễn trừ trách nhiệm
Thông tin và các ấn phẩm này không nhằm mục đích, và không cấu thành, lời khuyên hoặc khuyến nghị về tài chính, đầu tư, giao dịch hay các loại khác do TradingView cung cấp hoặc xác nhận. Đọc thêm tại Điều khoản Sử dụng.
Bài đăng liên quan
Thông báo miễn trừ trách nhiệm
Thông tin và các ấn phẩm này không nhằm mục đích, và không cấu thành, lời khuyên hoặc khuyến nghị về tài chính, đầu tư, giao dịch hay các loại khác do TradingView cung cấp hoặc xác nhận. Đọc thêm tại Điều khoản Sử dụng.