
Like Explained in the previous Idea about GOLD
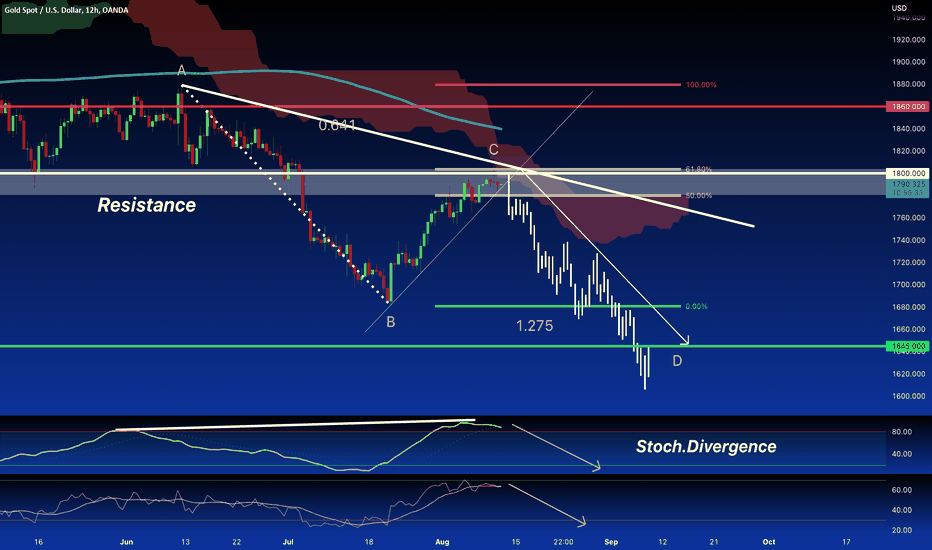
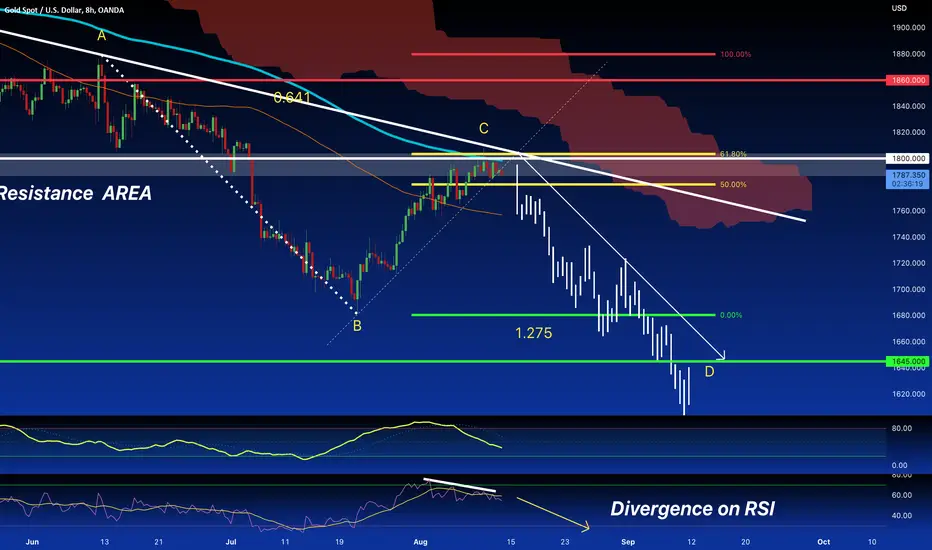
Today we Analyze the GOLD chart from the 8H timeframe for a better zoom of the situation. The price after a Deep Pullback, touched and reject the 61.8% Fibo area of resistance ( White rectangle ) around 1800.00 and, as we can see the price seems ready to revert its bullish momentum in favor of the Main trend, the Bearish one.The price also feel the 200 SMA in this timeframe like a dynamic resistance to not go over. The RSI is still in overbought with divergences, Ichimoku also in this timeframe gives a Bearish forecast and our clues continue to be for a Bearish setup.
Today we Analyze the GOLD chart from the 8H timeframe for a better zoom of the situation. The price after a Deep Pullback, touched and reject the 61.8% Fibo area of resistance ( White rectangle ) around 1800.00 and, as we can see the price seems ready to revert its bullish momentum in favor of the Main trend, the Bearish one.The price also feel the 200 SMA in this timeframe like a dynamic resistance to not go over. The RSI is still in overbought with divergences, Ichimoku also in this timeframe gives a Bearish forecast and our clues continue to be for a Bearish setup.
Ghi chú
NEW UPDATE 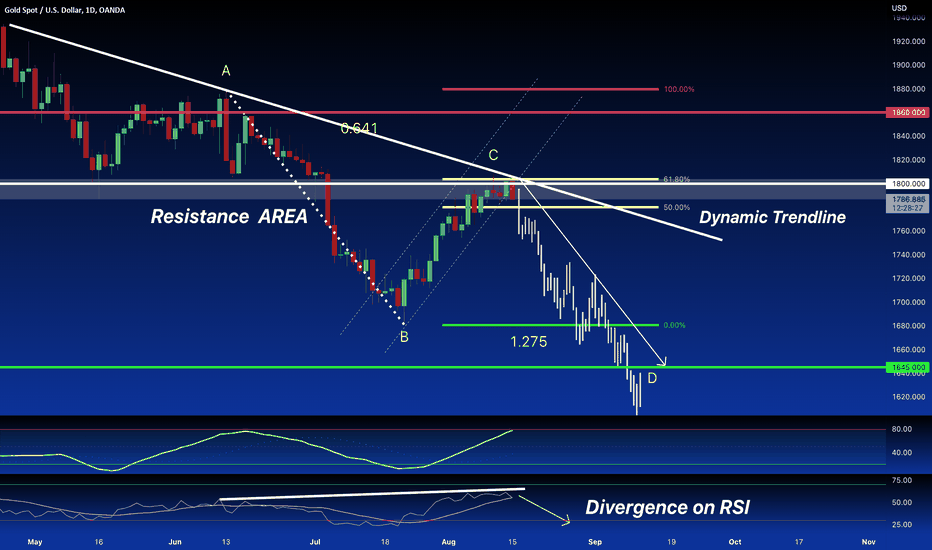

Bài đăng liên quan
Thông báo miễn trừ trách nhiệm
Thông tin và các ấn phẩm này không nhằm mục đích, và không cấu thành, lời khuyên hoặc khuyến nghị về tài chính, đầu tư, giao dịch hay các loại khác do TradingView cung cấp hoặc xác nhận. Đọc thêm tại Điều khoản Sử dụng.
Bài đăng liên quan
Thông báo miễn trừ trách nhiệm
Thông tin và các ấn phẩm này không nhằm mục đích, và không cấu thành, lời khuyên hoặc khuyến nghị về tài chính, đầu tư, giao dịch hay các loại khác do TradingView cung cấp hoặc xác nhận. Đọc thêm tại Điều khoản Sử dụng.