
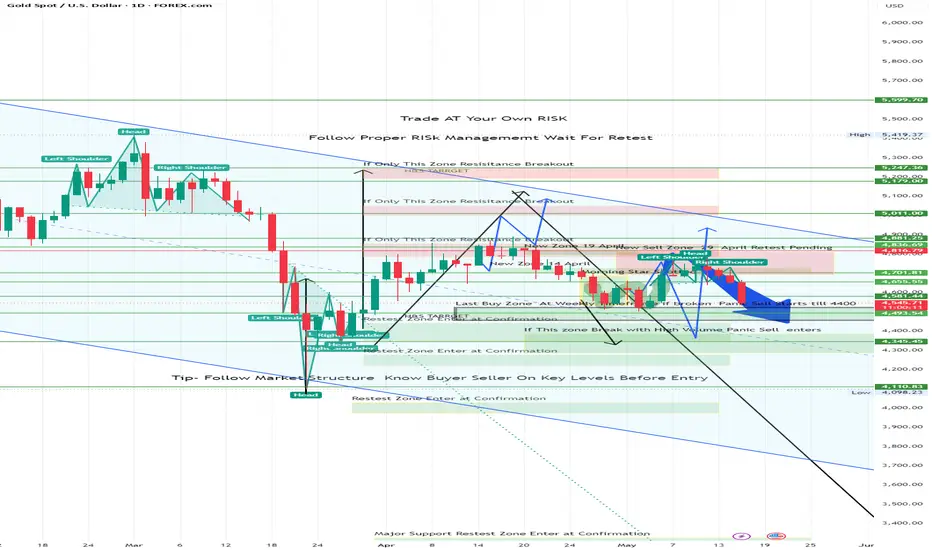
The market has now reacted strongly to the zones discussed in our previous case studies, and an important structural message is becoming clearer:
⚠️ The W Pattern failed to sustain.
After showing temporary bullish recovery attempts, price failed to hold above the key resistance and retest areas. The market respected the previously marked weekly sell zones and resumed weakness under broader bearish pressure.
🔍 What Happened?
In earlier updates:
We discussed the possibility of a bullish recovery if resistance zones were reclaimed
A bullish engulfing candle and W formation hinted at short-term upside
However, confirmation above higher resistance never sustained
Now the market has:
✅ Retested the weekly supply zone
✅ Failed near resistance structure
✅ Shifted momentum back toward bearish continuation
This is why structure confirmation matters more than pattern appearance alone.
📉 Current Market Structure
The broader trend still remains:
Lower highs
Heavy resistance pressure
Weak bullish follow-through
Repeated rejection from supply zones
The recent rejection near the 4700–4800 region reinforces the idea that sellers are still defending higher levels aggressively.
📌 Key Zones Going Forward
🔴 Resistance / Supply:
4700 – 4880 zone
5011 higher resistance
5179+ major breakout confirmation area
🟢 Support / Reaction Areas:
4490 – 4345 important reaction zone
4110 structural support
Deeper panic sell continuation possible below weekly support breaks
Weekly Buy zone 4450-4500 will be Point of Interest if final Bullish structure sustains.
🧠 Professional Perspective
One of the biggest lessons from this case study is:
A pattern without higher timeframe alignment often fails.
The W pattern looked attractive visually, but the:
Weekly trend remained bearish
Market was still trading under descending structure
Supply zones were never fully reclaimed
This created a high probability of rejection rather than sustained reversal.
📚 What This Teaches Traders
✅ Trend context matters more than candle excitement
✅ Retest failures often reveal true market direction
✅ Bigger timeframe pressure dominates smaller timeframe optimism
✅ Patience near zones is more valuable than prediction
The market is currently behaving like a classic:
📌 “Relief rally inside a bearish structure.”
⚠️ Important Reminder
Patterns can fail unexpectedly during:
Strong weekly trends
High volatility sessions
Weekend gaps / Friday reactions
News-driven liquidity events
Always combine:
Structure + Confirmation + Risk Management
📖 Series Continuation
This post continues our earlier XAUUSD educational case studies where:
Head & Shoulder structures were mapped
Sell zones were identified
Retest behaviour was discussed step-by-step
The market’s reaction to those zones is now becoming a live lesson in trend continuation psychology.
⚠️ Educational case study only. Not financial advice. Trade at your own risk.
#XAUUSD #GoldAnalysis #TradingEducation #MarketStructure #PriceAction #TradingPsychology #SupplyAndDemand #SmartMoneyConcepts #RiskManagement #TechnicalAnalysis #YogirajTradingAcademy
⚠️ The W Pattern failed to sustain.
After showing temporary bullish recovery attempts, price failed to hold above the key resistance and retest areas. The market respected the previously marked weekly sell zones and resumed weakness under broader bearish pressure.
🔍 What Happened?
In earlier updates:
We discussed the possibility of a bullish recovery if resistance zones were reclaimed
A bullish engulfing candle and W formation hinted at short-term upside
However, confirmation above higher resistance never sustained
Now the market has:
✅ Retested the weekly supply zone
✅ Failed near resistance structure
✅ Shifted momentum back toward bearish continuation
This is why structure confirmation matters more than pattern appearance alone.
📉 Current Market Structure
The broader trend still remains:
Lower highs
Heavy resistance pressure
Weak bullish follow-through
Repeated rejection from supply zones
The recent rejection near the 4700–4800 region reinforces the idea that sellers are still defending higher levels aggressively.
📌 Key Zones Going Forward
🔴 Resistance / Supply:
4700 – 4880 zone
5011 higher resistance
5179+ major breakout confirmation area
🟢 Support / Reaction Areas:
4490 – 4345 important reaction zone
4110 structural support
Deeper panic sell continuation possible below weekly support breaks
Weekly Buy zone 4450-4500 will be Point of Interest if final Bullish structure sustains.
🧠 Professional Perspective
One of the biggest lessons from this case study is:
A pattern without higher timeframe alignment often fails.
The W pattern looked attractive visually, but the:
Weekly trend remained bearish
Market was still trading under descending structure
Supply zones were never fully reclaimed
This created a high probability of rejection rather than sustained reversal.
📚 What This Teaches Traders
✅ Trend context matters more than candle excitement
✅ Retest failures often reveal true market direction
✅ Bigger timeframe pressure dominates smaller timeframe optimism
✅ Patience near zones is more valuable than prediction
The market is currently behaving like a classic:
📌 “Relief rally inside a bearish structure.”
⚠️ Important Reminder
Patterns can fail unexpectedly during:
Strong weekly trends
High volatility sessions
Weekend gaps / Friday reactions
News-driven liquidity events
Always combine:
Structure + Confirmation + Risk Management
📖 Series Continuation
This post continues our earlier XAUUSD educational case studies where:
Head & Shoulder structures were mapped
Sell zones were identified
Retest behaviour was discussed step-by-step
The market’s reaction to those zones is now becoming a live lesson in trend continuation psychology.
⚠️ Educational case study only. Not financial advice. Trade at your own risk.
#XAUUSD #GoldAnalysis #TradingEducation #MarketStructure #PriceAction #TradingPsychology #SupplyAndDemand #SmartMoneyConcepts #RiskManagement #TechnicalAnalysis #YogirajTradingAcademy

Bài đăng liên quan
Thông báo miễn trừ trách nhiệm
Thông tin và các ấn phẩm này không nhằm mục đích, và không cấu thành, lời khuyên hoặc khuyến nghị về tài chính, đầu tư, giao dịch hay các loại khác do TradingView cung cấp hoặc xác nhận. Đọc thêm tại Điều khoản Sử dụng.
Bài đăng liên quan
Thông báo miễn trừ trách nhiệm
Thông tin và các ấn phẩm này không nhằm mục đích, và không cấu thành, lời khuyên hoặc khuyến nghị về tài chính, đầu tư, giao dịch hay các loại khác do TradingView cung cấp hoặc xác nhận. Đọc thêm tại Điều khoản Sử dụng.