
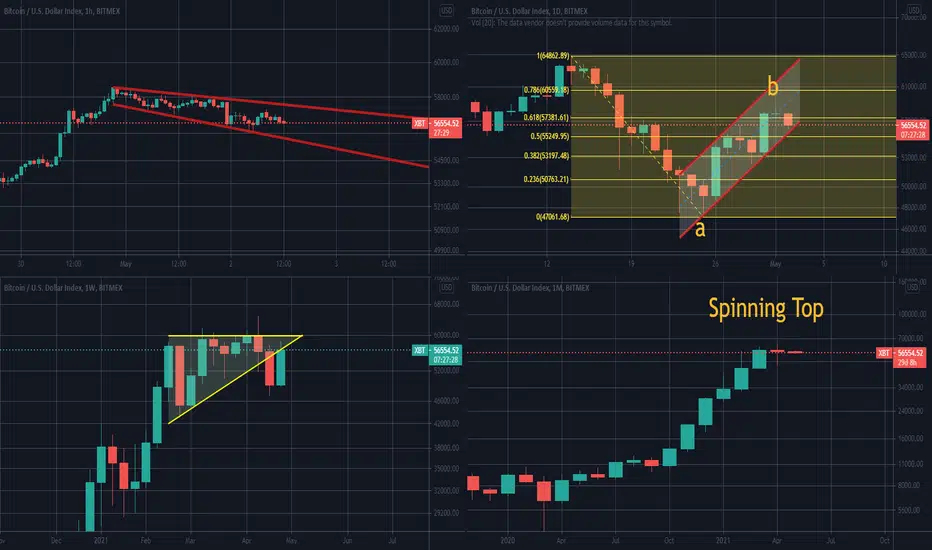
Hourly Chart: Expanding Triangle(Bearish)
Daily Chart: Bearish Flag + Doji followed by confirmation Candle at 0.618 Fibonacci level. (Bearish)
Weekly Chart: Closing below Flat Top triangle for 2 weeks, and Bullish Engulfing after a Spinning Top and confirmation. (Neutral-Bullish)
Monthly Chart: Spinning Top after 13 months of Parabolic price move.
Change in Average Dollar Value of Trades: in the first 4 months of 2021 in comparison to the last 4 months of 2020.
Conclusion: Bearish is the most probable scenario.
Moshkelgosha
Educational Articles:
1-Triangle:
https://www.investopedia.com/articles/technical/03/091003.asp
2- Retracement vs reversal:
https://www.investopedia.com/articles/trading/06/retracements.asp
3- Fibonacci Retracement Levels:
https://www.investopedia.com/terms/f/fibonacciretracement.asp
4-Flag:
https://www.investopedia.com/terms/f/flag.asp
5- Bullish Engulfing:
https://www.investopedia.com/terms/b/bullishengulfingpattern.asp
6-Spinning Top:
https://www.investopedia.com/terms/s/spinning-top.asp
7- Parabolic uptrend:
https://www.investopedia.com/what-you-need-to-know-about-tesla-s-parabolic-uptrend-4784179

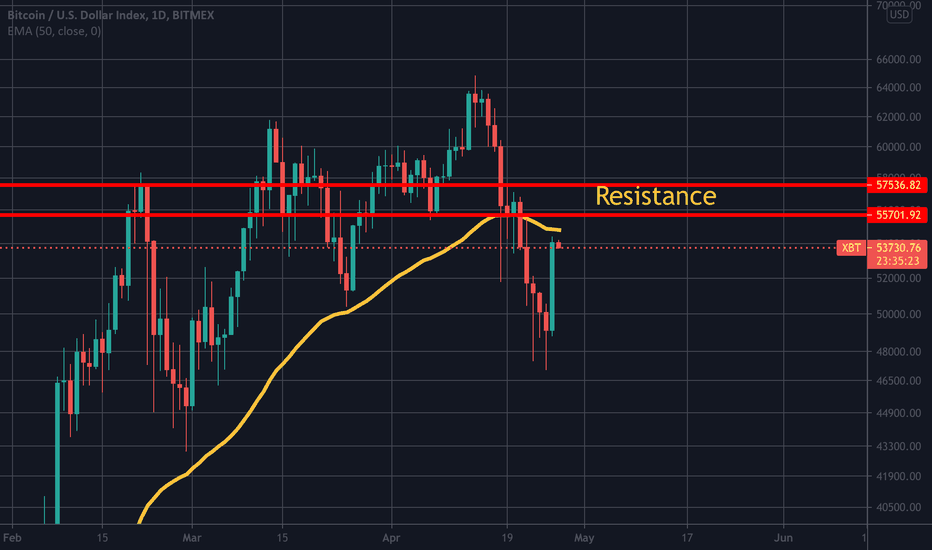
Daily Chart: Bearish Flag + Doji followed by confirmation Candle at 0.618 Fibonacci level. (Bearish)
Weekly Chart: Closing below Flat Top triangle for 2 weeks, and Bullish Engulfing after a Spinning Top and confirmation. (Neutral-Bullish)
Monthly Chart: Spinning Top after 13 months of Parabolic price move.
Change in Average Dollar Value of Trades: in the first 4 months of 2021 in comparison to the last 4 months of 2020.
Conclusion: Bearish is the most probable scenario.
Moshkelgosha
Educational Articles:
1-Triangle:
https://www.investopedia.com/articles/technical/03/091003.asp
2- Retracement vs reversal:
https://www.investopedia.com/articles/trading/06/retracements.asp
3- Fibonacci Retracement Levels:
https://www.investopedia.com/terms/f/fibonacciretracement.asp
4-Flag:
https://www.investopedia.com/terms/f/flag.asp
5- Bullish Engulfing:
https://www.investopedia.com/terms/b/bullishengulfingpattern.asp
6-Spinning Top:
https://www.investopedia.com/terms/s/spinning-top.asp
7- Parabolic uptrend:
https://www.investopedia.com/what-you-need-to-know-about-tesla-s-parabolic-uptrend-4784179

Use the following link to access trading ideas: patreon.com/SniperTraderStocks?utm_medium=unknown&utm_source=join_link&utm_campaign=creatorshare_creator&utm_content=copyLink
Thông báo miễn trừ trách nhiệm
Thông tin và các ấn phẩm này không nhằm mục đích, và không cấu thành, lời khuyên hoặc khuyến nghị về tài chính, đầu tư, giao dịch hay các loại khác do TradingView cung cấp hoặc xác nhận. Đọc thêm tại Điều khoản Sử dụng.
Use the following link to access trading ideas: patreon.com/SniperTraderStocks?utm_medium=unknown&utm_source=join_link&utm_campaign=creatorshare_creator&utm_content=copyLink
Thông báo miễn trừ trách nhiệm
Thông tin và các ấn phẩm này không nhằm mục đích, và không cấu thành, lời khuyên hoặc khuyến nghị về tài chính, đầu tư, giao dịch hay các loại khác do TradingView cung cấp hoặc xác nhận. Đọc thêm tại Điều khoản Sử dụng.