
The pull back of yesterday could be over!
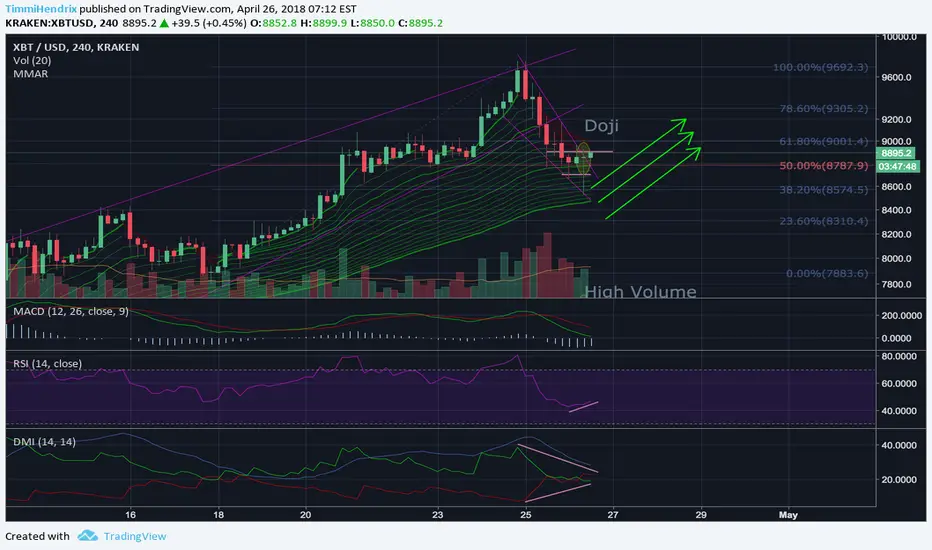
We see a huge Doji candle with a high volume which indicates a reversal. This Doji formed at 50% fibonacci level --> Bounce off this support level.
Additionaly we broke thru the down trend line of the falling wedge. This gives us also a signal to go long.
RSI stopped going down and shows us a consolidation. DMI shows gives us the same signal.
If we break thru the double bottom neckline on 30min Chart at 8900 we should expect a continuation of the uptrend for short term which will tell us if the up trend on 4h has enough power to go further.
Here the 30min Chart:

We see a huge Doji candle with a high volume which indicates a reversal. This Doji formed at 50% fibonacci level --> Bounce off this support level.
Additionaly we broke thru the down trend line of the falling wedge. This gives us also a signal to go long.
RSI stopped going down and shows us a consolidation. DMI shows gives us the same signal.
If we break thru the double bottom neckline on 30min Chart at 8900 we should expect a continuation of the uptrend for short term which will tell us if the up trend on 4h has enough power to go further.
Here the 30min Chart:
Ghi chú
It's on!If the this 30min candle closes above 8900 we're up again!
Ghi chú
Almost did it, but we're still on!
Ghi chú
Still in consolidation phase. Waiting for price action..Ghi chú
Seems like we're on track!Ghi chú
Next resistance @ 9600Can we break it?

Thông báo miễn trừ trách nhiệm
Thông tin và các ấn phẩm này không nhằm mục đích, và không cấu thành, lời khuyên hoặc khuyến nghị về tài chính, đầu tư, giao dịch hay các loại khác do TradingView cung cấp hoặc xác nhận. Đọc thêm tại Điều khoản Sử dụng.
Thông báo miễn trừ trách nhiệm
Thông tin và các ấn phẩm này không nhằm mục đích, và không cấu thành, lời khuyên hoặc khuyến nghị về tài chính, đầu tư, giao dịch hay các loại khác do TradingView cung cấp hoặc xác nhận. Đọc thêm tại Điều khoản Sử dụng.