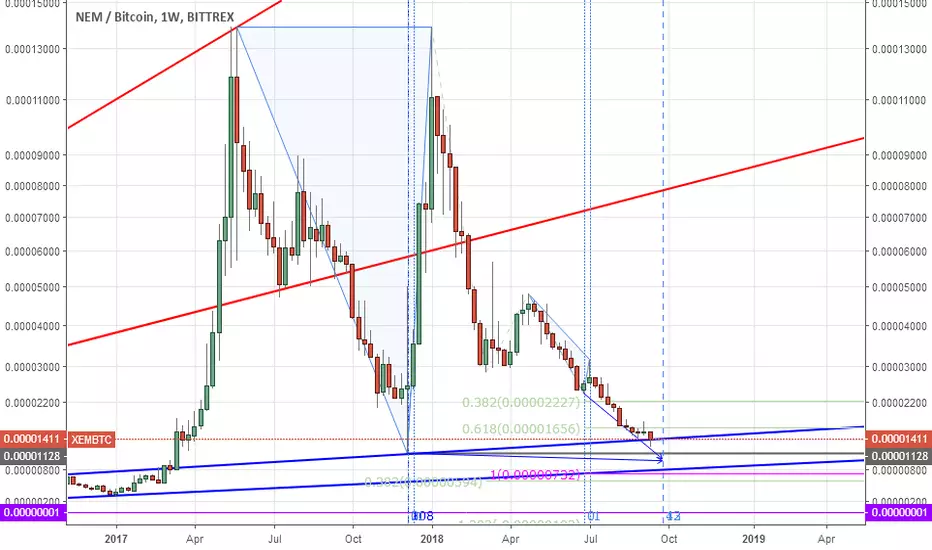
showing here the same possible reversal week 24-30 September. Ermanometry in case of XEM does not work however so precise in comparison to BTCUSD weekly chart (after all time high made by Bitcoin - before that time ermanometric calculations seem not to work properly). But XEMBTC chart suggests possible nearing of ending this bear market here. Some spike up should be drawed by market forces here. The only question is when.
Ghi chú
XEMUSD have one week eralier his ermanometric, turning point. That from 13 August gave limited effect.
Bài đăng liên quan
Thông báo miễn trừ trách nhiệm
Thông tin và các ấn phẩm này không nhằm mục đích, và không cấu thành, lời khuyên hoặc khuyến nghị về tài chính, đầu tư, giao dịch hay các loại khác do TradingView cung cấp hoặc xác nhận. Đọc thêm tại Điều khoản Sử dụng.
Bài đăng liên quan
Thông báo miễn trừ trách nhiệm
Thông tin và các ấn phẩm này không nhằm mục đích, và không cấu thành, lời khuyên hoặc khuyến nghị về tài chính, đầu tư, giao dịch hay các loại khác do TradingView cung cấp hoặc xác nhận. Đọc thêm tại Điều khoản Sử dụng.