Giá mua
XLM is Bullish
SWING TRADING ANALYSIS
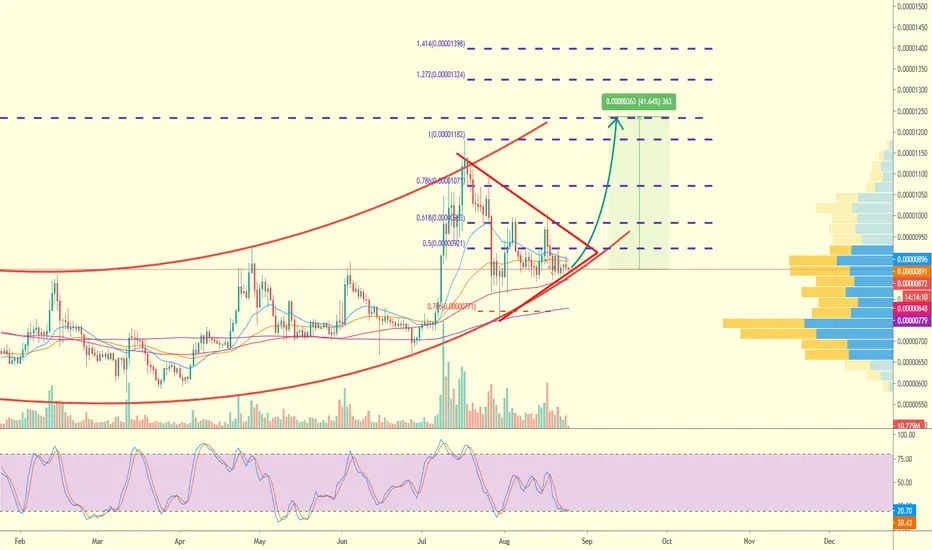
XLM in the bullish channel(red lines) right know, it can higher because the volume of accumulation is high in currently price, you can see it from the spike of volume profile
The decreasing of volume is a sign that it will pump in a days
The oscilator showed the price is currenctly low, that means it is oversold right know
Trading plan :
Entry : 850 - 890
Target 1 : 1074
Target 2 : 1186
Target 3 : 1238
Target 4 : 1328
Stop loss : 800
Enjoy the profit later 🤑🤑🤑
XLM in the bullish channel(red lines) right know, it can higher because the volume of accumulation is high in currently price, you can see it from the spike of volume profile
The decreasing of volume is a sign that it will pump in a days
The oscilator showed the price is currenctly low, that means it is oversold right know
Trading plan :
Entry : 850 - 890
Target 1 : 1074
Target 2 : 1186
Target 3 : 1238
Target 4 : 1328
Stop loss : 800
Enjoy the profit later 🤑🤑🤑

Thông báo miễn trừ trách nhiệm
Thông tin và các ấn phẩm này không nhằm mục đích, và không cấu thành, lời khuyên hoặc khuyến nghị về tài chính, đầu tư, giao dịch hay các loại khác do TradingView cung cấp hoặc xác nhận. Đọc thêm tại Điều khoản Sử dụng.
Thông báo miễn trừ trách nhiệm
Thông tin và các ấn phẩm này không nhằm mục đích, và không cấu thành, lời khuyên hoặc khuyến nghị về tài chính, đầu tư, giao dịch hay các loại khác do TradingView cung cấp hoặc xác nhận. Đọc thêm tại Điều khoản Sử dụng.