Chart Pattern
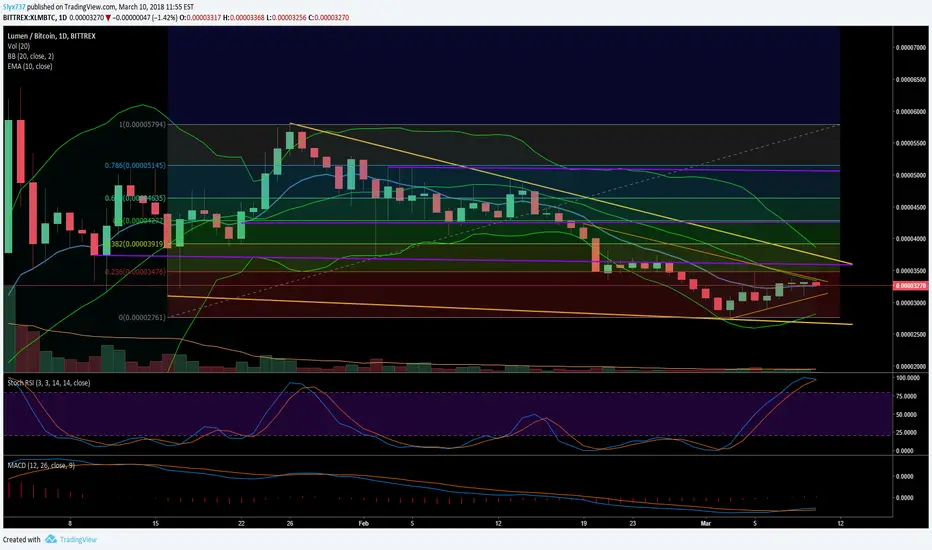
XLM is forming a falling wedge within a falling wedge. This is a strong indication the price will break to the upside.
Exponential Moving Average
The 10 day EMA has positioned itself right below the current price forming strong support.
Bollinger Bands
The recent pullback in the market has caused the upper and lower bands to widen. The middle band is currently active resistance and we need to break 3355 before we can expect to see a bullish move towards the psychological resistance and .236 fib level at 3530.
StochasticRSI
Stochastic is very high, currently at 96 we should see some selling off and this is confirmed by the bearish spinning top on the current candle.
MACD
The MACD is relatively low. XLM has become quite oversold as the altcoin market has dropped over the past few days. There is a small bullish upcross. But we need more volume and a lower RSI before a buy would be signaled.
XLM is forming a falling wedge within a falling wedge. This is a strong indication the price will break to the upside.
Exponential Moving Average
The 10 day EMA has positioned itself right below the current price forming strong support.
Bollinger Bands
The recent pullback in the market has caused the upper and lower bands to widen. The middle band is currently active resistance and we need to break 3355 before we can expect to see a bullish move towards the psychological resistance and .236 fib level at 3530.
StochasticRSI
Stochastic is very high, currently at 96 we should see some selling off and this is confirmed by the bearish spinning top on the current candle.
MACD
The MACD is relatively low. XLM has become quite oversold as the altcoin market has dropped over the past few days. There is a small bullish upcross. But we need more volume and a lower RSI before a buy would be signaled.

Thông báo miễn trừ trách nhiệm
Thông tin và các ấn phẩm này không nhằm mục đích, và không cấu thành, lời khuyên hoặc khuyến nghị về tài chính, đầu tư, giao dịch hay các loại khác do TradingView cung cấp hoặc xác nhận. Đọc thêm tại Điều khoản Sử dụng.
Thông báo miễn trừ trách nhiệm
Thông tin và các ấn phẩm này không nhằm mục đích, và không cấu thành, lời khuyên hoặc khuyến nghị về tài chính, đầu tư, giao dịch hay các loại khác do TradingView cung cấp hoặc xác nhận. Đọc thêm tại Điều khoản Sử dụng.