
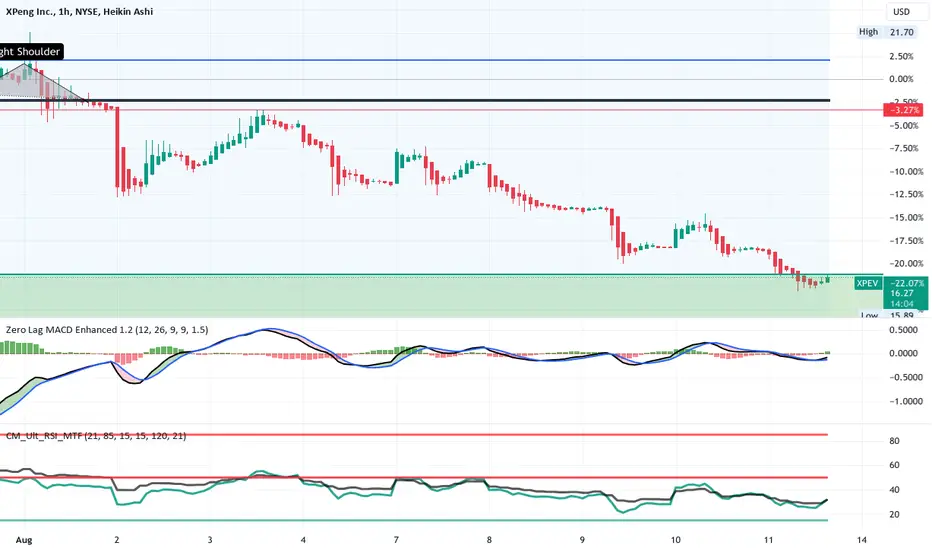
XPEV a few weeks back had the hype and excitement of the VW deal marked on the 1H chart
as a head and shoulders from which it has falled onto a thick support and demand zone
at the present. The ZL MACD indicator shows a line cross under the histogram which has
went red to green. On the dual TF RS indicator the greenlower TF has crossed above the
black higher TF and they are both rising reflecting two green candles marking a reversal.
I will get in this long trade early an plan to get 16-18% out of it.

Thông báo miễn trừ trách nhiệm
Thông tin và các ấn phẩm này không nhằm mục đích, và không cấu thành, lời khuyên hoặc khuyến nghị về tài chính, đầu tư, giao dịch hay các loại khác do TradingView cung cấp hoặc xác nhận. Đọc thêm tại Điều khoản Sử dụng.
Thông báo miễn trừ trách nhiệm
Thông tin và các ấn phẩm này không nhằm mục đích, và không cấu thành, lời khuyên hoặc khuyến nghị về tài chính, đầu tư, giao dịch hay các loại khác do TradingView cung cấp hoặc xác nhận. Đọc thêm tại Điều khoản Sử dụng.