
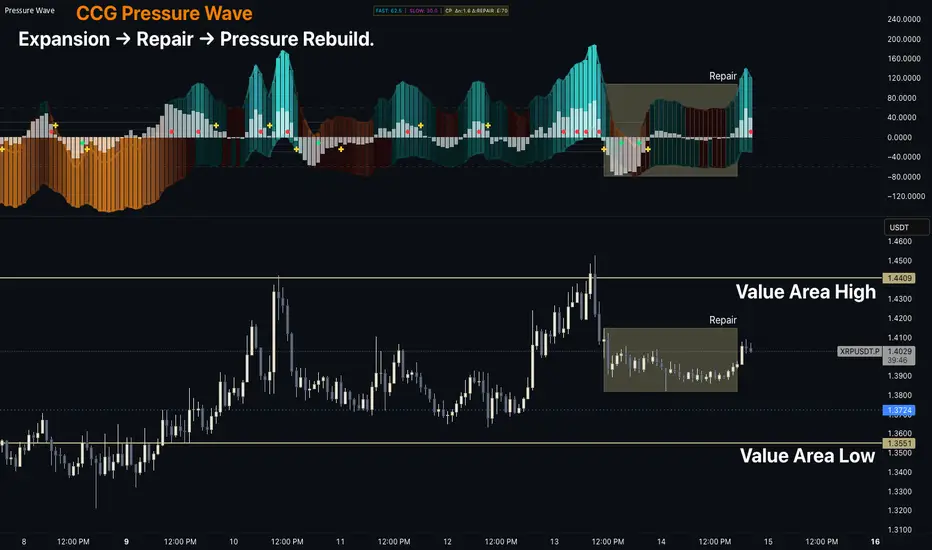
Markets rarely move in straight lines. Most impulses are followed by a repair phase where price compresses and participation cools.
In this example, price enters a range near Value Area High while Pressure Wave shows pressure contracting and flattening — a sign the market is digesting the prior move rather than committing to a new one.
As the range matures, pressure begins rebuilding internally before price attempts to move again. This shift in participation is what Pressure Wave is designed to visualize.
The goal isn’t prediction — it’s clarity.
Seeing when pressure is expanding, repairing, or rebuilding helps traders better understand the current phase of the auction.
In this example, price enters a range near Value Area High while Pressure Wave shows pressure contracting and flattening — a sign the market is digesting the prior move rather than committing to a new one.
As the range matures, pressure begins rebuilding internally before price attempts to move again. This shift in participation is what Pressure Wave is designed to visualize.
The goal isn’t prediction — it’s clarity.
Seeing when pressure is expanding, repairing, or rebuilding helps traders better understand the current phase of the auction.

Confluence Command Group | TradingView tools and chart lessons
ccgtradingllc.com
ccgtradingllc.com
Thông báo miễn trừ trách nhiệm
Thông tin và các ấn phẩm này không nhằm mục đích, và không cấu thành, lời khuyên hoặc khuyến nghị về tài chính, đầu tư, giao dịch hay các loại khác do TradingView cung cấp hoặc xác nhận. Đọc thêm tại Điều khoản Sử dụng.
Confluence Command Group | TradingView tools and chart lessons
ccgtradingllc.com
ccgtradingllc.com
Thông báo miễn trừ trách nhiệm
Thông tin và các ấn phẩm này không nhằm mục đích, và không cấu thành, lời khuyên hoặc khuyến nghị về tài chính, đầu tư, giao dịch hay các loại khác do TradingView cung cấp hoặc xác nhận. Đọc thêm tại Điều khoản Sử dụng.