
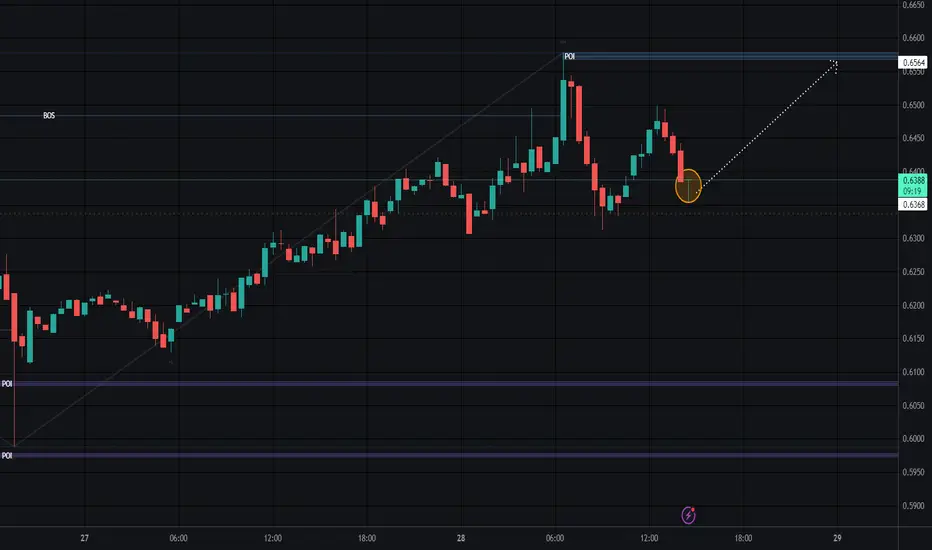
Judging by this candlestick, the neat chart pattern formation indicate a strong bullish momentum, as well as a clear support and resistance zone. I expect a retest of the 0.6570 resistance soon. If it breaks and holds, we’ll be heading towards the next target at 0.6680, followed by the 0.70 and 0.73 levels that we saw on Nov 23rd.
My theory . . . when price breaks and holds above that line, the bulls are going to have an epic rally up the chart!
Only time will tell. Please share your thoughts, opinions, predictions, criticisms, etc.
My theory . . . when price breaks and holds above that line, the bulls are going to have an epic rally up the chart!
Only time will tell. Please share your thoughts, opinions, predictions, criticisms, etc.

Thông báo miễn trừ trách nhiệm
Thông tin và các ấn phẩm này không nhằm mục đích, và không cấu thành, lời khuyên hoặc khuyến nghị về tài chính, đầu tư, giao dịch hay các loại khác do TradingView cung cấp hoặc xác nhận. Đọc thêm tại Điều khoản Sử dụng.
Thông báo miễn trừ trách nhiệm
Thông tin và các ấn phẩm này không nhằm mục đích, và không cấu thành, lời khuyên hoặc khuyến nghị về tài chính, đầu tư, giao dịch hay các loại khác do TradingView cung cấp hoặc xác nhận. Đọc thêm tại Điều khoản Sử dụng.