
WTI Crude Oil (XTI/USD) – Rebound Off the 200-day EMA Eyes Major Compression Resistance
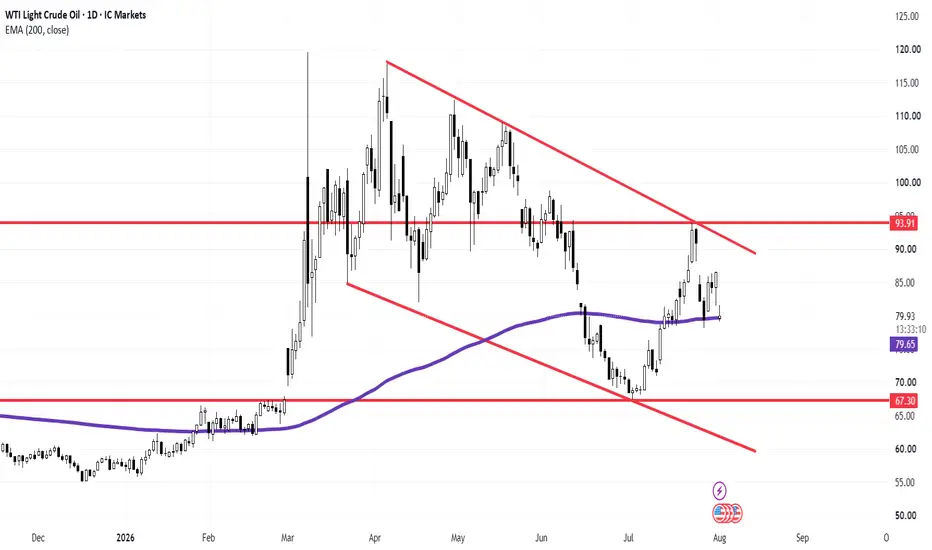
WTI Crude Oil (XTI/USD) has staged a sharp recovery on the daily chart, bouncing strongly after defending its 200-day Exponential Moving Average (EMA) (sitting at $79.65). The asset is now compressing inside a large multi-month symmetrical wedge structure (red trendlines), setting the stage for a high-conviction directional breakout.
Technical Breakdown:
The 200-day EMA Support ($79.65):
Bulls successfully defended the 200-day EMA at $79.65, validating it as a reliable dynamic floor.
As long as price action trades above this purple moving average, the immediate daily momentum favours the upside.
The Major Resistance Zone ($93.91 & Upper Trendline):
The primary upside target and critical barrier for the bulls sits at $93.91 (horizontal resistance), which closely aligns with the upper descending trendline (LTB).
A decisive daily close above $93.91 would signal a structural breakout, paving the way for a rally towards the psychological $100.00 threshold.
The Bearish Breakdown Scenario ($67.30 Target):
Conversely, if sellers step in near the $93.91 resistance and force a rejection back below the 200-day EMA ($79.65), the bullish recovery will be invalidated.
A breakdown below $79.65 would open the doors for a retest of the major macro demand floor at $67.30.
Trading Insight: Watch the reaction closely as price approaches the $93.91 resistance level. A clean breakout above $93.91 opens long positions towards $100.00+, whereas a rejection offers a short-swing opportunity back down to test the 200-day EMA ($79.65).
WTI Crude Oil (XTI/USD) has staged a sharp recovery on the daily chart, bouncing strongly after defending its 200-day Exponential Moving Average (EMA) (sitting at $79.65). The asset is now compressing inside a large multi-month symmetrical wedge structure (red trendlines), setting the stage for a high-conviction directional breakout.
Technical Breakdown:
The 200-day EMA Support ($79.65):
Bulls successfully defended the 200-day EMA at $79.65, validating it as a reliable dynamic floor.
As long as price action trades above this purple moving average, the immediate daily momentum favours the upside.
The Major Resistance Zone ($93.91 & Upper Trendline):
The primary upside target and critical barrier for the bulls sits at $93.91 (horizontal resistance), which closely aligns with the upper descending trendline (LTB).
A decisive daily close above $93.91 would signal a structural breakout, paving the way for a rally towards the psychological $100.00 threshold.
The Bearish Breakdown Scenario ($67.30 Target):
Conversely, if sellers step in near the $93.91 resistance and force a rejection back below the 200-day EMA ($79.65), the bullish recovery will be invalidated.
A breakdown below $79.65 would open the doors for a retest of the major macro demand floor at $67.30.
Trading Insight: Watch the reaction closely as price approaches the $93.91 resistance level. A clean breakout above $93.91 opens long positions towards $100.00+, whereas a rejection offers a short-swing opportunity back down to test the 200-day EMA ($79.65).

Thông báo miễn trừ trách nhiệm
Thông tin và các ấn phẩm này không nhằm mục đích, và không cấu thành, lời khuyên hoặc khuyến nghị về tài chính, đầu tư, giao dịch hay các loại khác do TradingView cung cấp hoặc xác nhận. Đọc thêm tại Điều khoản Sử dụng.
Thông báo miễn trừ trách nhiệm
Thông tin và các ấn phẩm này không nhằm mục đích, và không cấu thành, lời khuyên hoặc khuyến nghị về tài chính, đầu tư, giao dịch hay các loại khác do TradingView cung cấp hoặc xác nhận. Đọc thêm tại Điều khoản Sử dụng.