Giá mua
VERGE Double Bottom ?
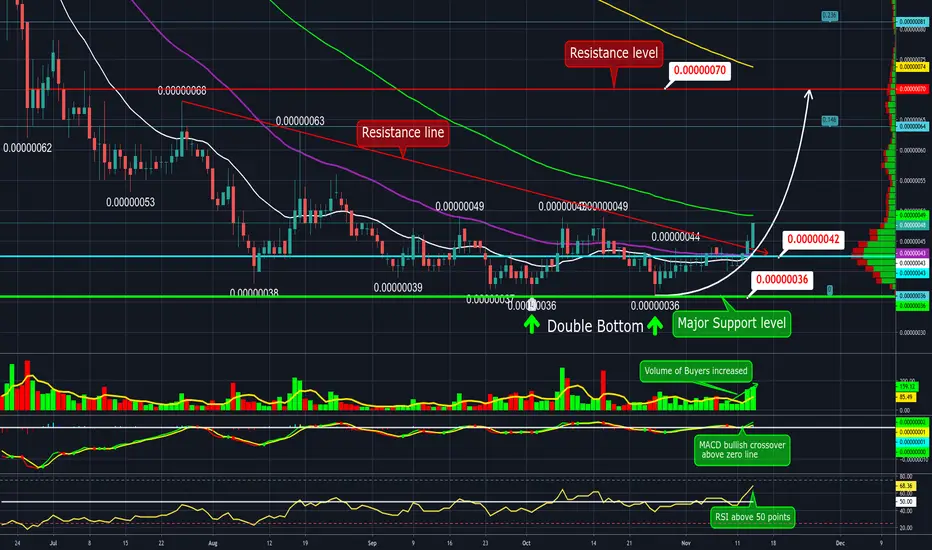
Verge price action above red resistance line breakout. Hodl above EMA 21,50 on daily TF. Testing EMA 100 which acting like resistance. Potential target 70 sats Resistance level.
Volume: of buyers increased.
Indicators: MACD bullish crossover above zero line. RSI above 50 points. Bullish sign.
Pattern: double bottom pattern at 36 sats.
S/R: Major Support 36 sats, Support 40 sats. Resistance 50 sats, Major Resistance 70 sats.
Disclaimer: THIS IS NOT FINANCIAL ADVICE. All the information shared here is for learning and entertainment purposes only.
Volume: of buyers increased.
Indicators: MACD bullish crossover above zero line. RSI above 50 points. Bullish sign.
Pattern: double bottom pattern at 36 sats.
S/R: Major Support 36 sats, Support 40 sats. Resistance 50 sats, Major Resistance 70 sats.
Disclaimer: THIS IS NOT FINANCIAL ADVICE. All the information shared here is for learning and entertainment purposes only.

Thông báo miễn trừ trách nhiệm
Thông tin và các ấn phẩm này không nhằm mục đích, và không cấu thành, lời khuyên hoặc khuyến nghị về tài chính, đầu tư, giao dịch hay các loại khác do TradingView cung cấp hoặc xác nhận. Đọc thêm tại Điều khoản Sử dụng.
Thông báo miễn trừ trách nhiệm
Thông tin và các ấn phẩm này không nhằm mục đích, và không cấu thành, lời khuyên hoặc khuyến nghị về tài chính, đầu tư, giao dịch hay các loại khác do TradingView cung cấp hoặc xác nhận. Đọc thêm tại Điều khoản Sử dụng.