
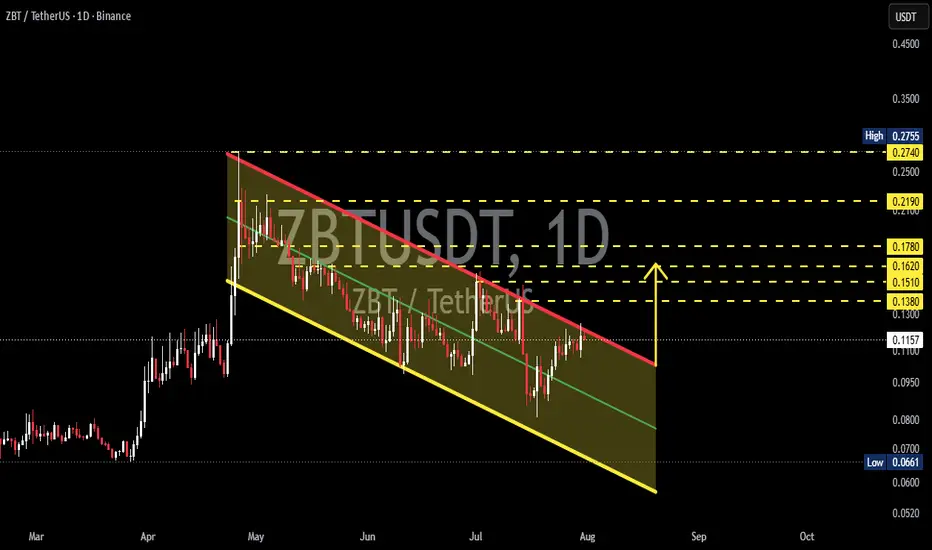
📊 Technical Analysis
💰 Coin: $ZBT #ZBT
⏳ Time Frame: 1D
📉 Pattern: Descending Channel (Bullish Reversal Setup)
🎯 Market Bias: Neutral to Bullish (Breakout Confirmation Required)
---
📌 Pattern Analysis
🔻 Descending Channel
ZBT is still trading inside a Descending Channel, a pattern formed by a series of lower highs and lower lows. Although this structure reflects short-term bearish pressure, a Descending Channel is often considered a bullish reversal pattern if the price successfully breaks above the upper resistance trendline with strong volume.
📍 At the moment, the price is approaching the upper trendline resistance, making this a critical decision zone for the next major move.
---
🟢 Bullish Scenario
✅ If ZBT successfully breaks above the red trendline and closes a daily candle above it, the probability of a trend reversal will increase significantly.
🎯 Potential upside targets:
🟡 0.1380 USDT
Initial resistance after the breakout.
🟡 0.1510 USDT
First major supply zone.
🟡 0.1620 USDT
Intermediate resistance level.
🟡 0.1780 USDT
Next bullish target if momentum remains strong.
🟡 0.2190 USDT
Major resistance where profit-taking may occur.
🟡 0.2740 USDT
Primary upside target and the previous swing high.
📈 A breakout supported by strong trading volume would significantly increase the probability of a new uptrend.
---
🔴 Bearish Scenario
❌ If the price gets rejected at the upper trendline and fails to break out, the Descending Channel will remain valid.
⚠️ In that case, the price may:
🔻 Retrace toward the channel midline, which acts as dynamic support.
🔻 Continue declining toward the lower trendline.
🔻 If the lower support is broken, selling pressure could intensify, leading to a deeper correction.
📉 As long as the channel resistance remains intact, traders should remain cautious of continued bearish momentum.
---
🔍 Key Levels
🟢 Resistance:
0.1380
0.1510
0.1620
0.1780
0.2190
0.2740
🔴 Support:
Descending Channel Midline
Descending Channel Lower Trendline
Previous Low around 0.0661
---
⚡ Trading Insight
💡 A Descending Channel frequently results in a bullish breakout, but confirmation is the key factor.
📊 Watch for:
✅ A daily candle closing above the resistance trendline.
✅ Increasing trading volume during the breakout.
✅ A successful retest of the broken resistance as new support.
Without these confirmations, the price may continue moving sideways or remain within the descending channel.
---
🎯 Conclusion
🚀 ZBT is currently trading at a critical decision point.
📈 A confirmed breakout from the Descending Channel could open the door for a rally toward the 0.1380–0.2740 USDT resistance zone.
📉 However, if the breakout fails, the price may remain inside the channel and retest the lower support levels.
⚠️ Always wait for breakout confirmation before making any trading decisions, as this area will likely determine ZBT's next major trend.
#ZBT #ZBTUSDT #Crypto #Cryptocurrency #Altcoin #TechnicalAnalysis #TradingView #Binance #PriceAction #DescendingChannel #Breakout #Bullish #Bearish #Support #Resistance #CryptoTrading #ChartAnalysis #Altcoins
💰 Coin: $ZBT #ZBT
⏳ Time Frame: 1D
📉 Pattern: Descending Channel (Bullish Reversal Setup)
🎯 Market Bias: Neutral to Bullish (Breakout Confirmation Required)
---
📌 Pattern Analysis
🔻 Descending Channel
ZBT is still trading inside a Descending Channel, a pattern formed by a series of lower highs and lower lows. Although this structure reflects short-term bearish pressure, a Descending Channel is often considered a bullish reversal pattern if the price successfully breaks above the upper resistance trendline with strong volume.
📍 At the moment, the price is approaching the upper trendline resistance, making this a critical decision zone for the next major move.
---
🟢 Bullish Scenario
✅ If ZBT successfully breaks above the red trendline and closes a daily candle above it, the probability of a trend reversal will increase significantly.
🎯 Potential upside targets:
🟡 0.1380 USDT
Initial resistance after the breakout.
🟡 0.1510 USDT
First major supply zone.
🟡 0.1620 USDT
Intermediate resistance level.
🟡 0.1780 USDT
Next bullish target if momentum remains strong.
🟡 0.2190 USDT
Major resistance where profit-taking may occur.
🟡 0.2740 USDT
Primary upside target and the previous swing high.
📈 A breakout supported by strong trading volume would significantly increase the probability of a new uptrend.
---
🔴 Bearish Scenario
❌ If the price gets rejected at the upper trendline and fails to break out, the Descending Channel will remain valid.
⚠️ In that case, the price may:
🔻 Retrace toward the channel midline, which acts as dynamic support.
🔻 Continue declining toward the lower trendline.
🔻 If the lower support is broken, selling pressure could intensify, leading to a deeper correction.
📉 As long as the channel resistance remains intact, traders should remain cautious of continued bearish momentum.
---
🔍 Key Levels
🟢 Resistance:
0.1380
0.1510
0.1620
0.1780
0.2190
0.2740
🔴 Support:
Descending Channel Midline
Descending Channel Lower Trendline
Previous Low around 0.0661
---
⚡ Trading Insight
💡 A Descending Channel frequently results in a bullish breakout, but confirmation is the key factor.
📊 Watch for:
✅ A daily candle closing above the resistance trendline.
✅ Increasing trading volume during the breakout.
✅ A successful retest of the broken resistance as new support.
Without these confirmations, the price may continue moving sideways or remain within the descending channel.
---
🎯 Conclusion
🚀 ZBT is currently trading at a critical decision point.
📈 A confirmed breakout from the Descending Channel could open the door for a rally toward the 0.1380–0.2740 USDT resistance zone.
📉 However, if the breakout fails, the price may remain inside the channel and retest the lower support levels.
⚠️ Always wait for breakout confirmation before making any trading decisions, as this area will likely determine ZBT's next major trend.
#ZBT #ZBTUSDT #Crypto #Cryptocurrency #Altcoin #TechnicalAnalysis #TradingView #Binance #PriceAction #DescendingChannel #Breakout #Bullish #Bearish #Support #Resistance #CryptoTrading #ChartAnalysis #Altcoins

✅ Get Free Signals! Join Our Telegram Channel Here: t.me/TheCryptoNuclear
✅ Twitter: twitter.com/crypto_nuclear
✅ Join Bybit : partner.bybit.com/b/nuclearvip
✅ Benefits : Lifetime Trading Fee Discount -50%
✅ Twitter: twitter.com/crypto_nuclear
✅ Join Bybit : partner.bybit.com/b/nuclearvip
✅ Benefits : Lifetime Trading Fee Discount -50%
Thông báo miễn trừ trách nhiệm
Thông tin và các ấn phẩm này không nhằm mục đích, và không cấu thành, lời khuyên hoặc khuyến nghị về tài chính, đầu tư, giao dịch hay các loại khác do TradingView cung cấp hoặc xác nhận. Đọc thêm tại Điều khoản Sử dụng.
✅ Get Free Signals! Join Our Telegram Channel Here: t.me/TheCryptoNuclear
✅ Twitter: twitter.com/crypto_nuclear
✅ Join Bybit : partner.bybit.com/b/nuclearvip
✅ Benefits : Lifetime Trading Fee Discount -50%
✅ Twitter: twitter.com/crypto_nuclear
✅ Join Bybit : partner.bybit.com/b/nuclearvip
✅ Benefits : Lifetime Trading Fee Discount -50%
Thông báo miễn trừ trách nhiệm
Thông tin và các ấn phẩm này không nhằm mục đích, và không cấu thành, lời khuyên hoặc khuyến nghị về tài chính, đầu tư, giao dịch hay các loại khác do TradingView cung cấp hoặc xác nhận. Đọc thêm tại Điều khoản Sử dụng.