
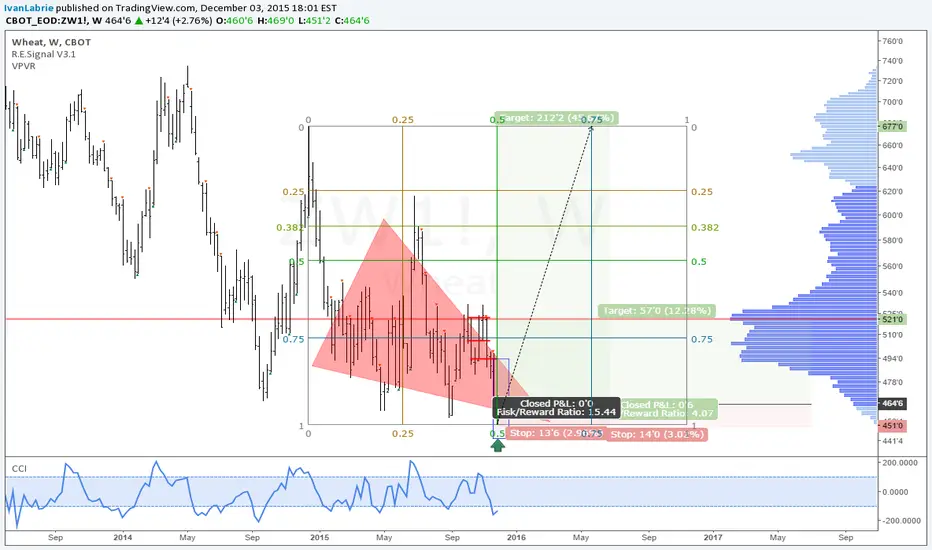
The wheat chart has a very interesting and huge terminal triangle in the weekly scale.
You can enter long as depicted on chart, and aim for the high volume node above, or even the start of the terminal triangle if it were to be valid.
As you can see in the related ideas, it's highly probable that the dollar has topped in the long term, and the macroeconomic landscape favors an increase in agricultural commodities.
Good luck,
Ivan Labrie
Giao dịch đang hoạt động
New highGhi chú
Such a beautiful trade...bravo me. :pHope someone took it.
Ghi chú
Soaring beautifully.Ghi chú
It's not looking good after hitting the first resistance.Ghi chú
We have a nice base here.Ghi chú
Failure to hit the target on chart in 2 days would imply there's pending upside here.
Ghi chú
We can add to longs at market, stop: 470

Public, timestamped track record. Free month of the desk: ivanlabrie.netlify.app
Bài đăng liên quan
Thông báo miễn trừ trách nhiệm
Thông tin và các ấn phẩm này không nhằm mục đích, và không cấu thành, lời khuyên hoặc khuyến nghị về tài chính, đầu tư, giao dịch hay các loại khác do TradingView cung cấp hoặc xác nhận. Đọc thêm tại Điều khoản Sử dụng.